
Enterprise AI Measurement Guide
Reliability
Total Incidents
Has the total count of production incidents changed alongside AI coding adoption, and how does the trend compare to CI/CD metrics?
What it shows
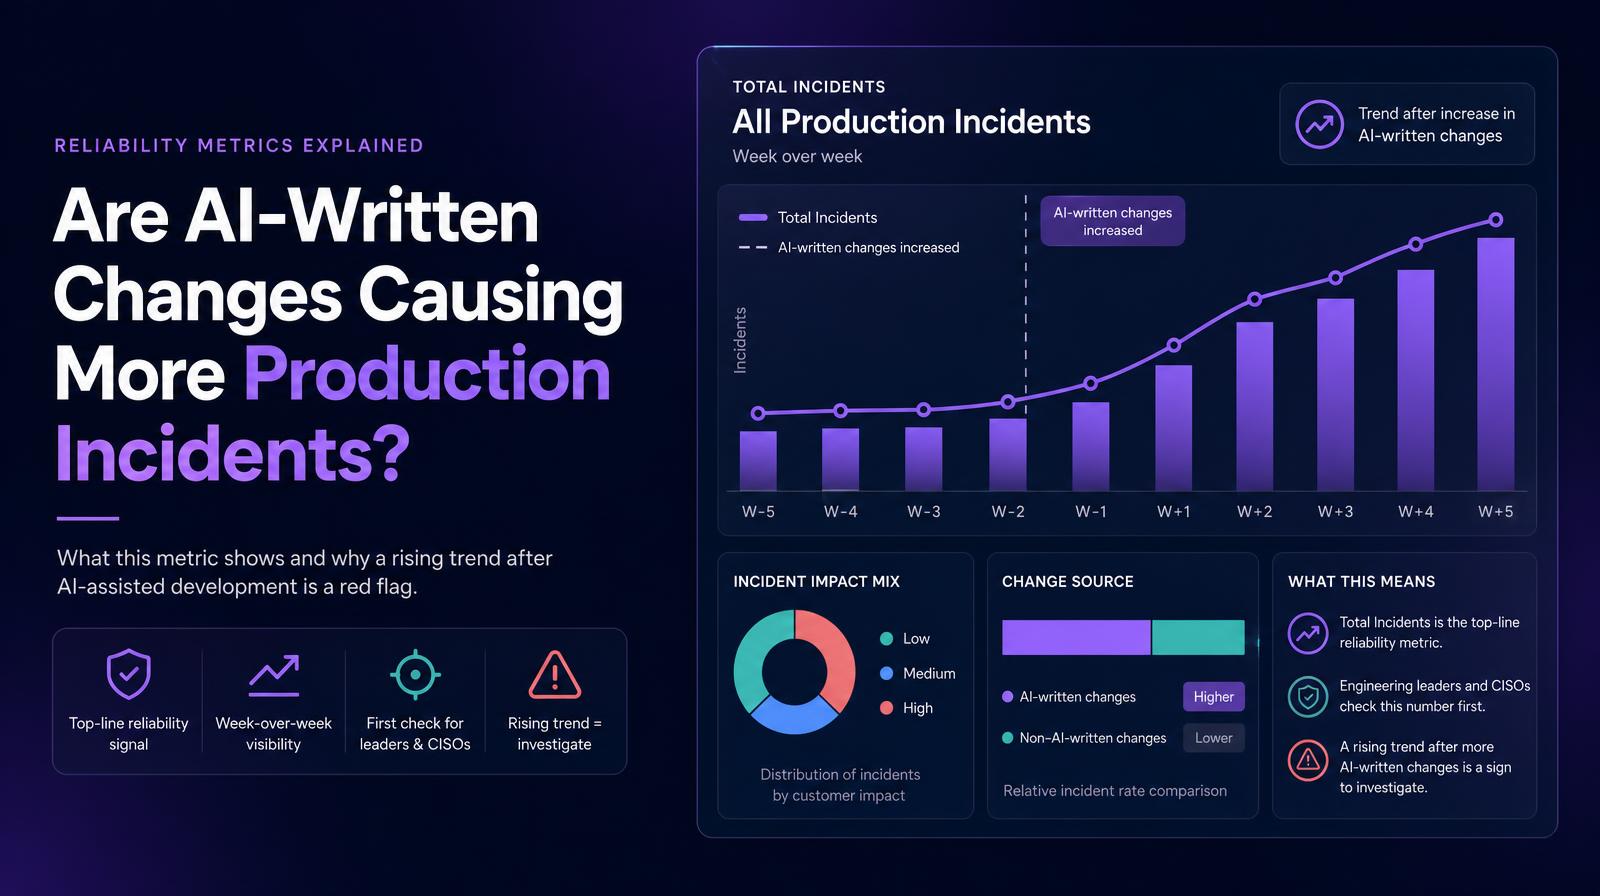
Total Incidents counts every production incident recorded in the selected period, with a week-over-week trend. As the top-line reliability metric, it is the first number engineering leaders and CISOs check to assess whether AI-assisted development is degrading production stability. The trend makes the trajectory visible, a rising incident count in the weeks following an AI coding agent rollout is a leading indicator that warrants investigation into whether agent-generated code is the contributing factor.
Why it matters
Total Incidents is the reliability equivalent of Deployment Frequency, the number that sets the stage for everything else. A team deploying 10x more frequently with AI agents could expect some rise in absolute incident count simply from volume; what matters is whether the incident rate (incidents per deploy) is rising or holding. Reading Total Incidents alongside Deployment Frequency (10/5 batch) and Change Failure Rate (10/5 batch) gives the complete picture. On its own, incident count is a triage signal; in combination, it becomes an attribution tool.
The Larridin angle
Larridin customer data shows that in orgs where one engineer holds a disproportionate share of on-call load, that same engineer is often the org's heaviest AI spender and highest CAV performer, cost, output, and operational burden stacking onto the same person in the same week. Total Incidents is the entry point into that cross-signal investigation. The trend over time makes it possible to correlate incident count changes with specific AI tooling or workflow changes rather than requiring a retrospective root cause analysis after the fact.
Related Reliability Metrics
Common questions
What does the Total Incidents metric indicate?
Total Incidents counts every production incident recorded in the selected period and shows a week-over-week trend, serving as a primary reliability metric.
Why is the Total Incidents metric important for engineering leaders and CISOs?
It helps assess whether AI-assisted development is affecting production stability, with a rising incident count indicating potential issues with AI-generated code.
How can Total Incidents be used in conjunction with other metrics?
Reading Total Incidents alongside Deployment Frequency and Change Failure Rate provides a complete picture of production stability and helps identify if AI coding agents are contributing to incident rates.
What insights does Larridin's data provide about AI usage and incident management?
Larridin's data shows that engineers with high AI tool usage often bear a disproportionate on-call load, highlighting the need to investigate incident trends in relation to AI tooling and workflows.