
Enterprise AI Measurement Guide
Reliability
P1 Incidents
How is the count of P1 production incidents trending, and how does it relate to the Total Incidents count and CI/CD metrics?
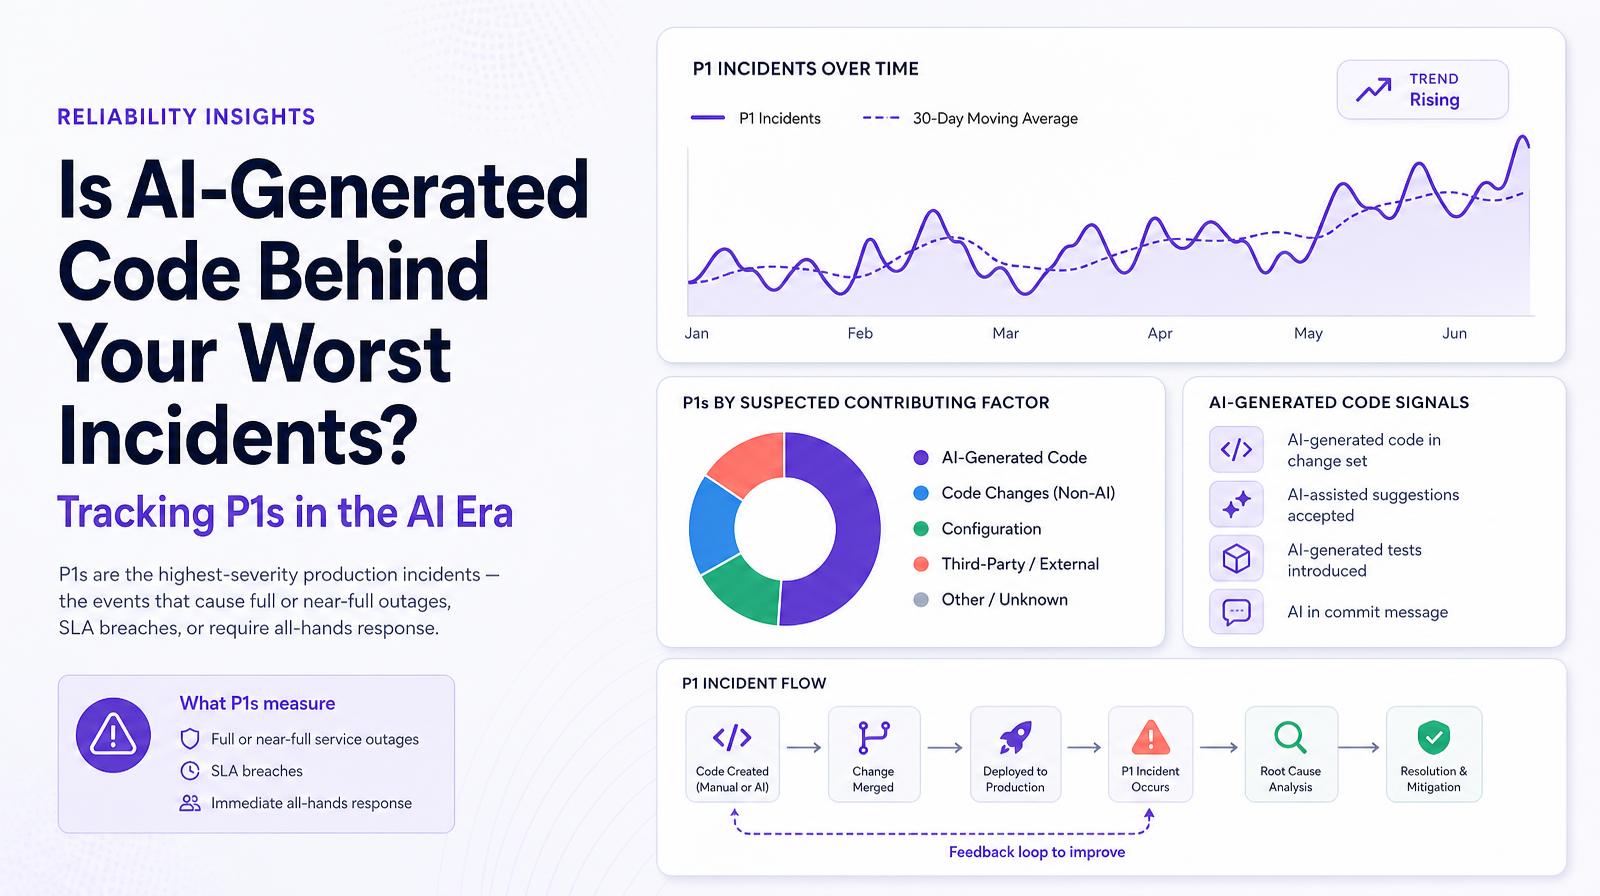
What it shows
P1 Incidents counts the number of highest-severity production incidents in the selected period, the events that represent full or near-full service outages, SLA breaches, or incidents requiring immediate all-hands response. The trend shows whether the most damaging category of incident is rising or falling. P1s are the reliability metric that directly connects to revenue impact, customer trust, and board-level risk reporting.
Why it matters
P1 count is the reliability metric that makes it out of engineering and into board meetings. A rising P1 trend alongside AI coding agent adoption is the scenario CISOs and board risk committees are most concerned about, not because AI necessarily caused the P1s, but because the causal question is unanswerable without the attribution data. Larridin's P1 count, read alongside Change Failure Rate and Deployment Log author data (10/5 batch), makes it possible to build a factual attribution picture rather than relying on retrospective blame assignment during post-mortems.
The Larridin angle
The P1 trend in Larridin is the board-facing reliability number that connects to the engineering-facing CI/CD and Quality metrics earlier in the dashboard. An engineering leader who can show a flat or declining P1 trend alongside rising AI Output Share has the data to make the case that AI adoption is not degrading production stability at the severity level that matters most.
Related Reliability Metrics
Common questions
What are P1 incidents?
P1 incidents are the highest-severity production incidents that result in full or near-full service outages, SLA breaches, or require an immediate all-hands response.
Why is the P1 incident count important for the C-suite?
The P1 incident count is crucial for the C-suite because it directly impacts revenue, customer trust, and board-level risk reporting.
How does Larridin help in understanding the impact of AI on P1 incidents?
Larridin provides a P1 trend metric that, when read alongside Change Failure Rate and Deployment Log data, helps build an objective attribution picture of AI's impact on production stability.
What concerns do CISOs and board risk committees have about AI coding agents?
CISOs and board risk committees are concerned about a rising P1 trend with AI adoption, as the causal relationship between AI and P1 incidents is difficult to determine without proper attribution data.