
Enterprise AI Measurement Guide
Reliability
Team Level Breakdown
How do we see each engineer's Incidents acked, MTTA, MTTR, Off-Hours Pages, and Pages per week in the Reliability tab?
What it shows
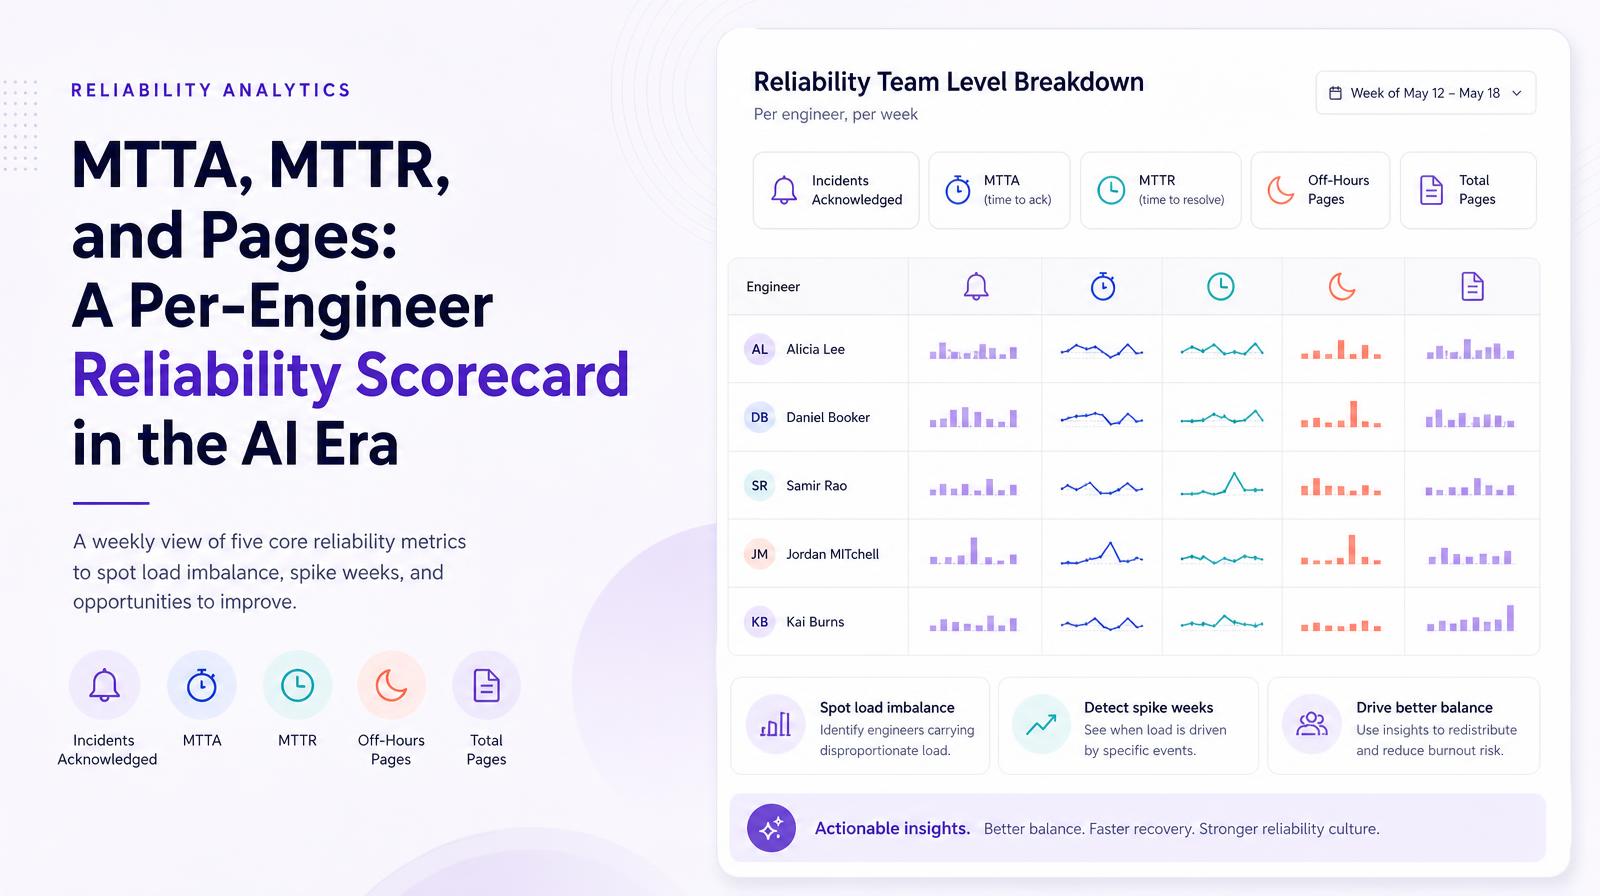
The Reliability Team Level Breakdown table shows five reliability metrics per engineer per week: Incidents acknowledged, MTTA, MTTR, Off-Hours Pages, and total Pages. The weekly granularity makes it possible to identify which engineers are carrying disproportionate load in any given week, and to see whether that load is consistent or driven by specific spike weeks corresponding to particular deployments or incidents.
Why it matters
This table is the reliability complement to the Quality and Velocity Team Level Breakdowns, it completes the per-engineer picture by adding operational burden alongside output and quality data. An engineer with high weekly CAV, high AI spend, and five times the team-average MTTR is a very different profile from an engineer with similar output metrics and average MTTR. The combination of output, cost, and reliability data at the per-engineer level is what makes workload balance decisions evidence-based rather than based on manager perception.
The Larridin angle
Larridin's per-engineer reliability scorecard is designed to be read alongside the Cost and Velocity Team Level Breakdowns in the same investigation, giving engineering leaders and CHROs the three-dimensional view of each contributor: what they produce, what they cost, and what operational burden they carry. No single-dimension view answers the question of whether an engineer is being deployed sustainably.
Related Reliability Metrics
Common questions
What does the Reliability Team Level Breakdown table show?
The table displays five reliability metrics per engineer per week: Incidents acknowledged, MTTA, MTTR, Off-Hours Pages, and total Pages, helping identify workload distribution among engineers.
Why is the Reliability Team Level Breakdown important for the C-suite?
It complements quality and velocity data by adding operational burden metrics, enabling evidence-based workload balance decisions rather than relying on manager perceptions.
How does Larridin's scorecard provide a comprehensive view of an engineer's performance?
The scorecard combines reliability, cost, and output data, offering a three-dimensional view of each engineer's contributions, expenses, and operational burden.
What insights can engineering leaders gain from the Reliability Team Level Breakdown?
Leaders can identify engineers with disproportionate workloads and understand whether these are consistent or due to specific incidents, aiding in sustainable deployment decisions.