
Enterprise AI Measurement Guide
Weekly Pulse
Velocity Stats
What do this week's Output/Eng/Week and PR Cycle Time figures show about engineering velocity?
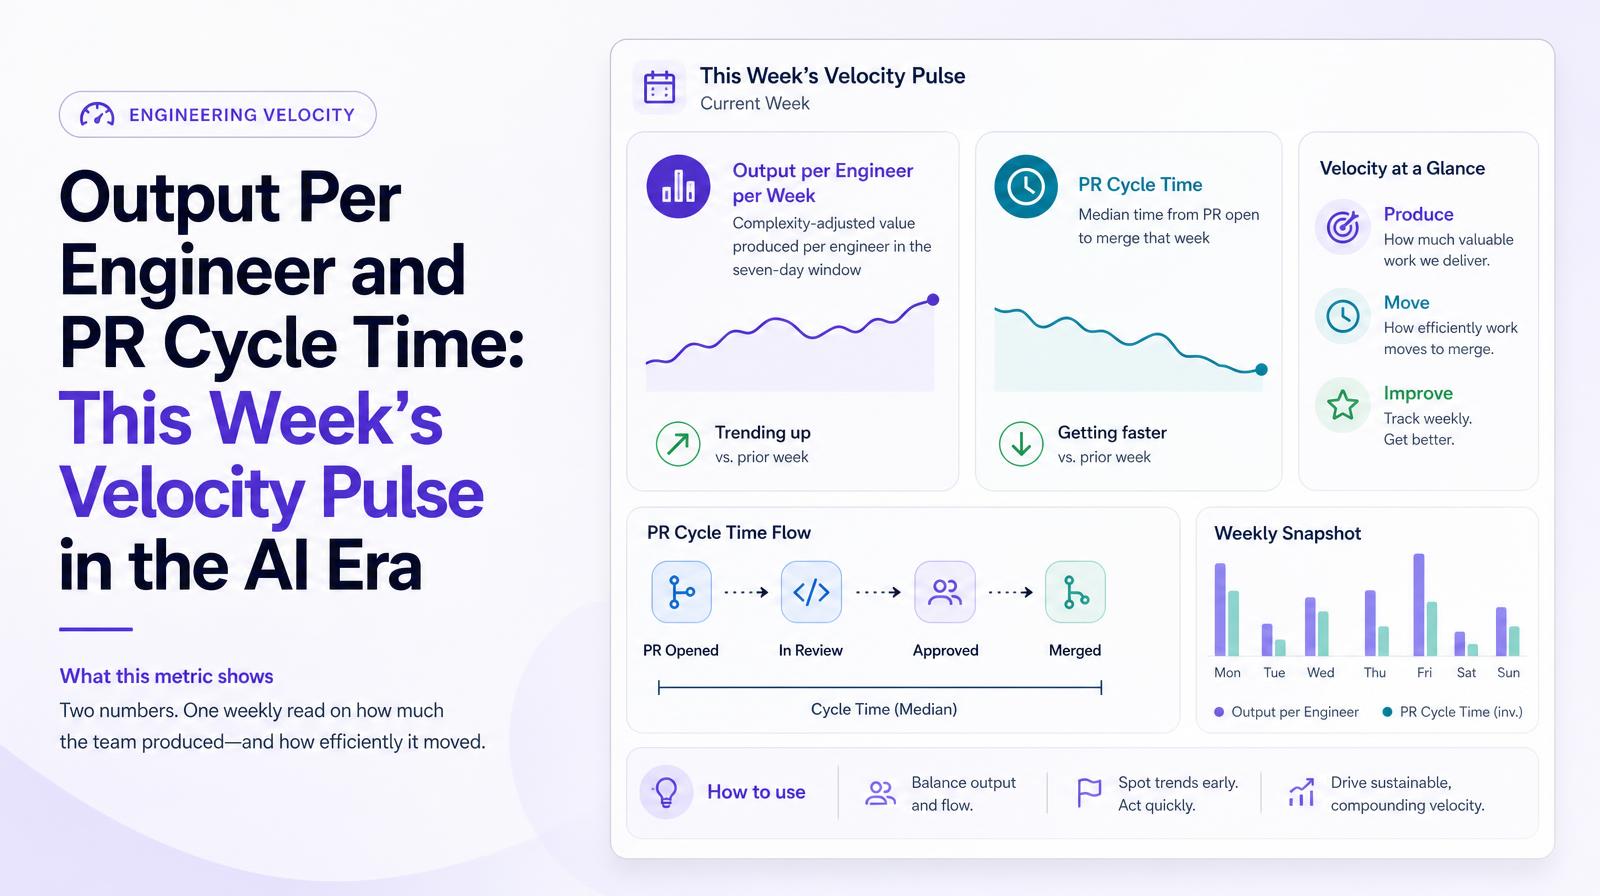
What it shows
The Velocity stats block shows two velocity metrics for the current week: Output per Engineer per Week (complexity-adjusted value produced per engineer in the seven-day window) and PR Cycle Time (median time from PR open to merge that week). These two numbers together give engineering leaders the weekly velocity read, how much the team produced and how efficiently it moved code through review.
Why it matters
Weekly velocity stats are the operational heartbeat of engineering AI investment. A week where Output per Engineer drops while PR Cycle Time rises is a leading indicator of a review bottleneck, more code is sitting in queue than is moving through. A week where both metrics improve is the confirmation that AI adoption is translating into genuine throughput gains that week, not just activity. The weekly cadence is the right resolution for velocity management: monthly averages smooth out the spikes that require mid-sprint intervention.
The Larridin angle
Larridin's complexity-adjusted Output per Engineer metric prevents the velocity stats from being gamed by volume. A week where an engineer ships 12 trivial PRs looks different from a week where they ship 3 complex architectural changes, and Larridin's scoring reflects that difference. This means the weekly Velocity stat is a reliable operational signal, not an incentive to generate more low-value commits.
Related Weekly Pulse Metrics
Common questions
What is the significance of Output per Engineer per Week in the Velocity stats?
Output per Engineer per Week measures the complexity-adjusted value produced by each engineer within a seven-day period, providing insight into individual productivity.
How does PR Cycle Time impact engineering efficiency?
PR Cycle Time tracks the median time from when a pull request is opened to when it is merged, indicating how efficiently code moves through the review process.
Why are weekly velocity stats important for engineering leaders?
Weekly velocity stats help engineering leaders identify bottlenecks and assess the impact of AI tools on productivity, allowing for timely interventions and adjustments.
How does Larridin ensure the reliability of its Output per Engineer metric?
Larridin's metric is complexity-adjusted, distinguishing between trivial and complex tasks to prevent gaming by volume, ensuring the stats reflect genuine productivity.