
Enterprise AI Measurement Guide
Weekly Pulse
Activity Map
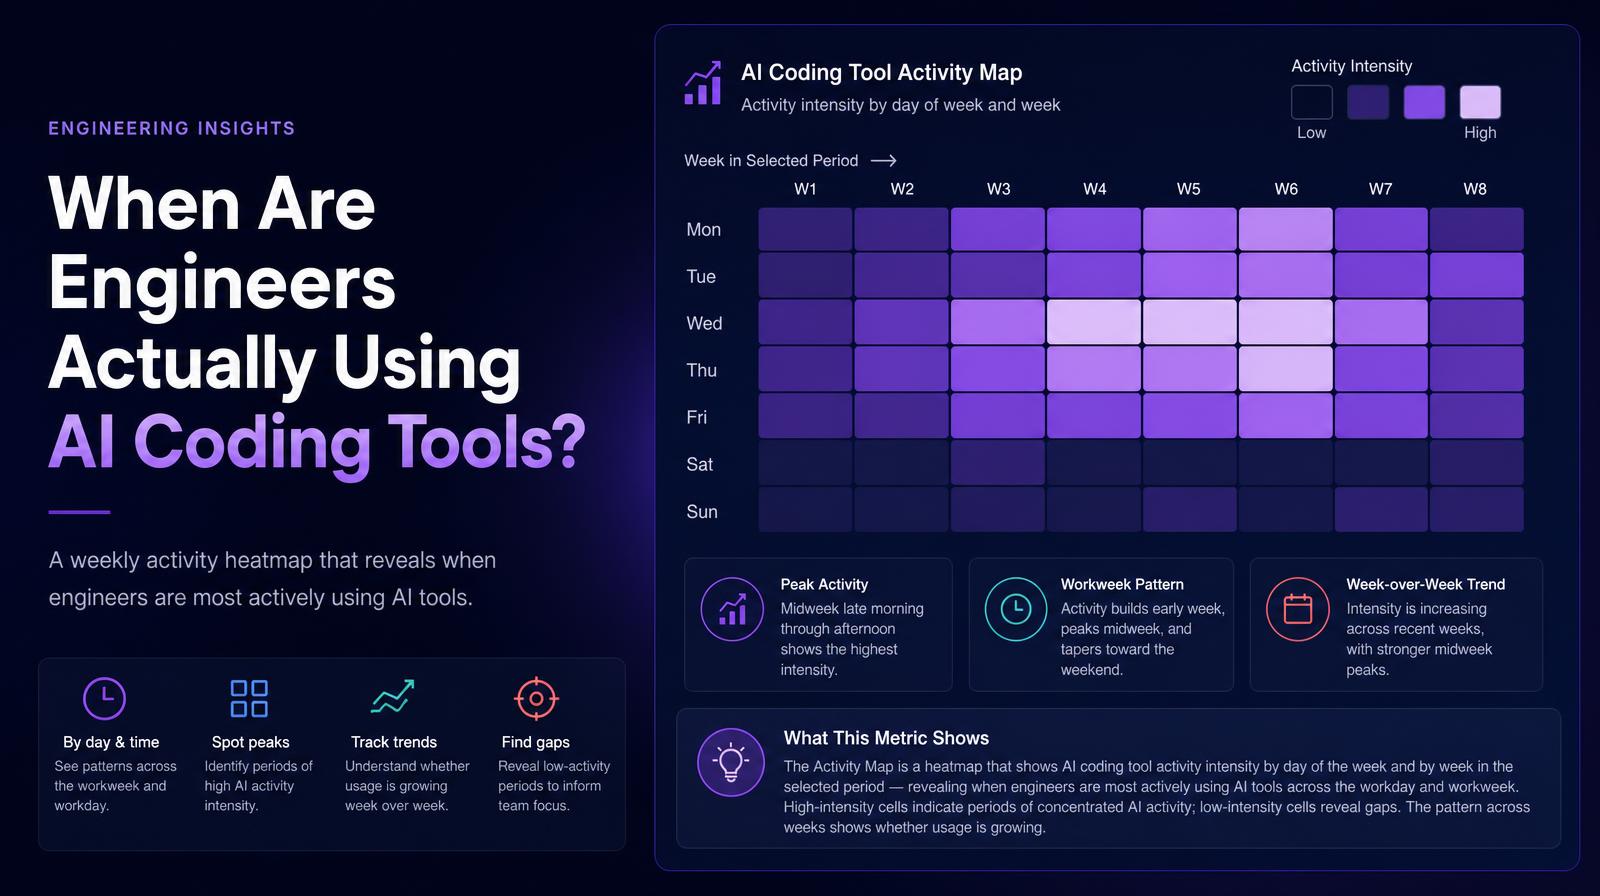
What does the Activity Map heatmap show about when AI coding tool activity is concentrated across days and weeks?
What it shows
The Activity Map is a heatmap that shows AI coding tool activity intensity by day of the week and by week in the selected period, revealing when engineers are most actively using AI tools across the workday and workweek. High-intensity cells indicate periods of concentrated AI activity; low-intensity cells reveal gaps. The pattern across weeks shows whether usage is growing, stabilizing, or declining.
Why it matters
The activity heatmap answers a question adoption percentages cannot: when is AI actually embedded in the engineering workflow, and when does it disappear? A team with high Monday morning and Thursday afternoon activity may be using AI for sprint planning and PR finalization but not during deep implementation work in between, which is an integration gap, not an adoption gap. For engineering leaders trying to understand where to invest in enablement, the heatmap shows which parts of the workweek AI has genuinely penetrated and which remain untouched.
The Larridin angle
The weekly heatmap also reveals on-call and incident impact on AI usage patterns. A week where one engineer dominated incident response often shows as a suppressed AI activity cell for that engineer in the same period, the same cross-signal that connects Reliability and Agent Effectiveness data. The Activity Map is the visual layer that makes that temporal correlation immediate.
Related Weekly Pulse Metrics
Common questions
What is the purpose of the Activity Map in the context of AI coding tools?
The Activity Map is designed to display the intensity of AI coding tool usage by day and week, helping to identify when engineers are most actively using these tools.
How can the Activity Map help engineering leaders?
The map helps leaders understand which parts of the workweek AI tools are integrated into and identify periods where AI usage is lacking, indicating potential areas for improvement.
What insights can be gained from high-intensity cells on the heatmap?
High-intensity cells indicate periods of concentrated AI activity, suggesting that engineers are heavily utilizing AI tools during these times.
How does the heatmap reveal the impact of on-call duties on AI tool usage?
The heatmap can show suppressed AI activity for engineers involved in incident response, highlighting the temporal correlation between on-call duties and AI tool usage.