
Enterprise AI Measurement Guide
Weekly Pulse
Engineering Report Narrative
What do the What Shipped and Room for Improvement summaries contain in the Engineering Report narrative?
What it shows
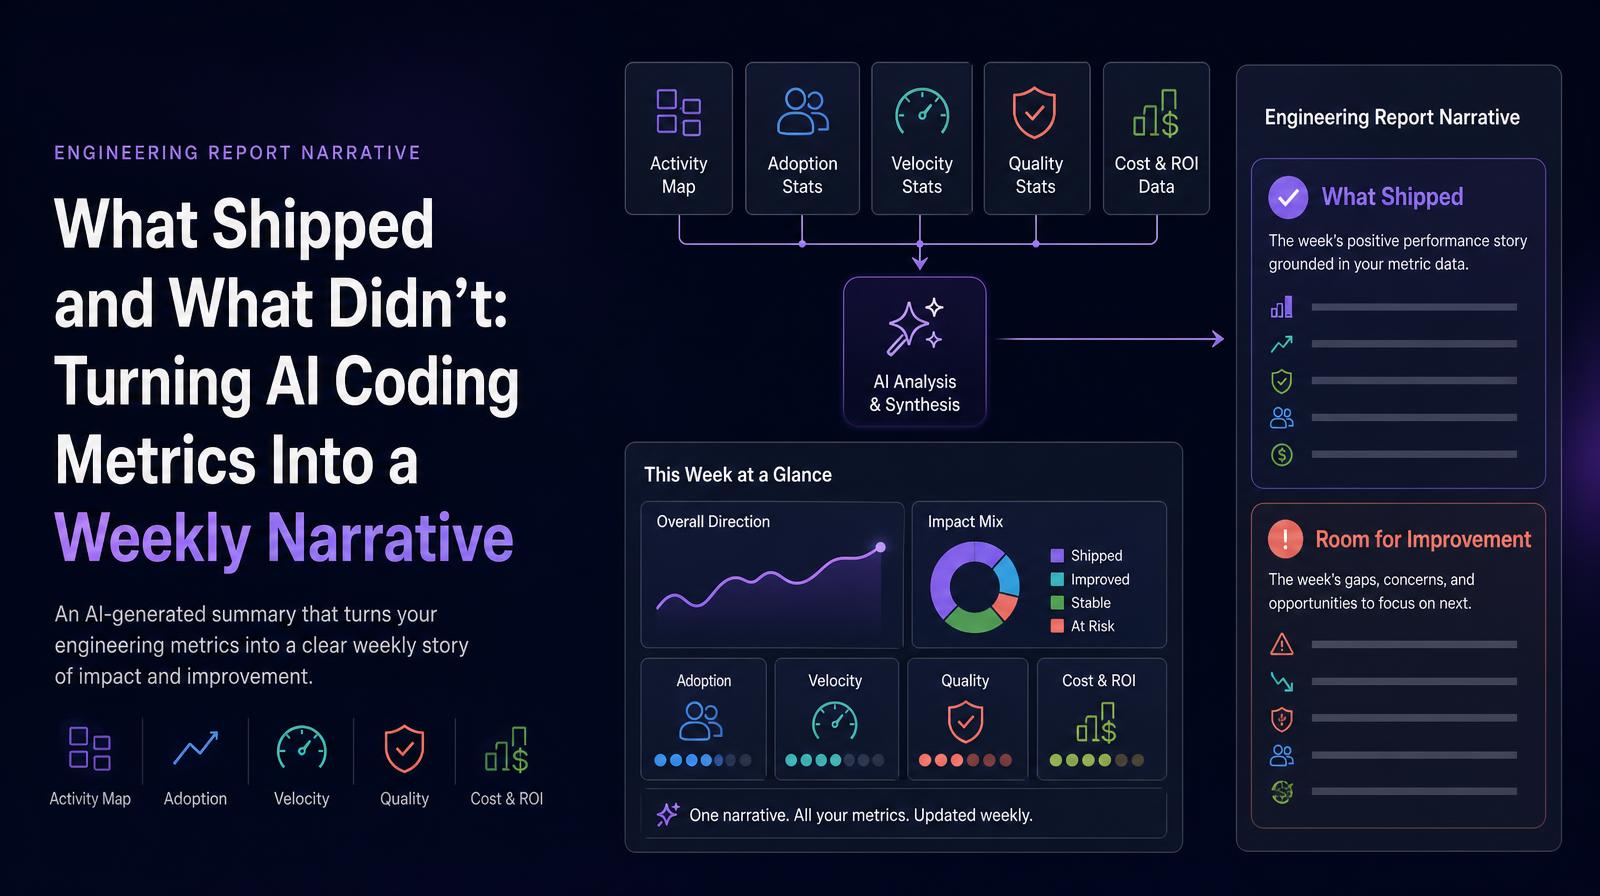
The Engineering Report narrative is an AI-generated written summary of the week's engineering performance, synthesizing the Activity Map, Adoption stats, Velocity stats, Quality stats, and Cost & ROI data into two structured narrative sections: What Shipped (the week's positive performance story grounded in the metric data) and Room for Improvement (the week's gaps, concerns, and areas requiring attention). It converts the quantitative Weekly Pulse into a board-ready or all-hands-ready narrative without requiring manual interpretation.
Why it matters
Engineering performance data is often locked inside dashboards that require technical fluency to interpret. The Engineering Report narrative translates that data into language accessible to CHROs, CFOs, and CEOs who need the weekly engineering story without needing to navigate five metric cards. It also ensures that the "what went well / what didn't" framing is grounded in system-measured data rather than manager estimation, which removes the recency bias and selective emphasis that characterizes manually written engineering updates.
The Larridin angle
The Engineering Report narrative is the output that makes the Weekly Pulse actionable across the entire C-suite, not just for engineering leaders. A CHRO can read the Room for Improvement section and understand whether the week's challenges reflect a training gap (low AI adoption with high cost), a workload imbalance (on-call burden concentrated on top performers), or a quality issue (rising code turnover), all framed in plain language grounded in the week's data.
Related Weekly Pulse Metrics
Common questions
What is the purpose of the Engineering Report narrative?
The Engineering Report narrative provides an AI-generated summary of weekly engineering performance, highlighting successes and areas for improvement in a format accessible to non-technical leaders.
How does the Engineering Report narrative benefit C-suite executives?
It translates complex engineering metrics into a narrative that is easy for C-suite executives to understand, allowing them to grasp the weekly engineering story without technical expertise.
What sections are included in the Engineering Report narrative?
The narrative includes two sections: 'What Shipped,' which details the week's positive outcomes, and 'Room for Improvement,' which identifies areas needing attention.
How does the narrative ensure accuracy without bias?
The narrative is grounded in system-measured data, avoiding recency bias and selective emphasis that can occur in manually written updates.