


TL;DR
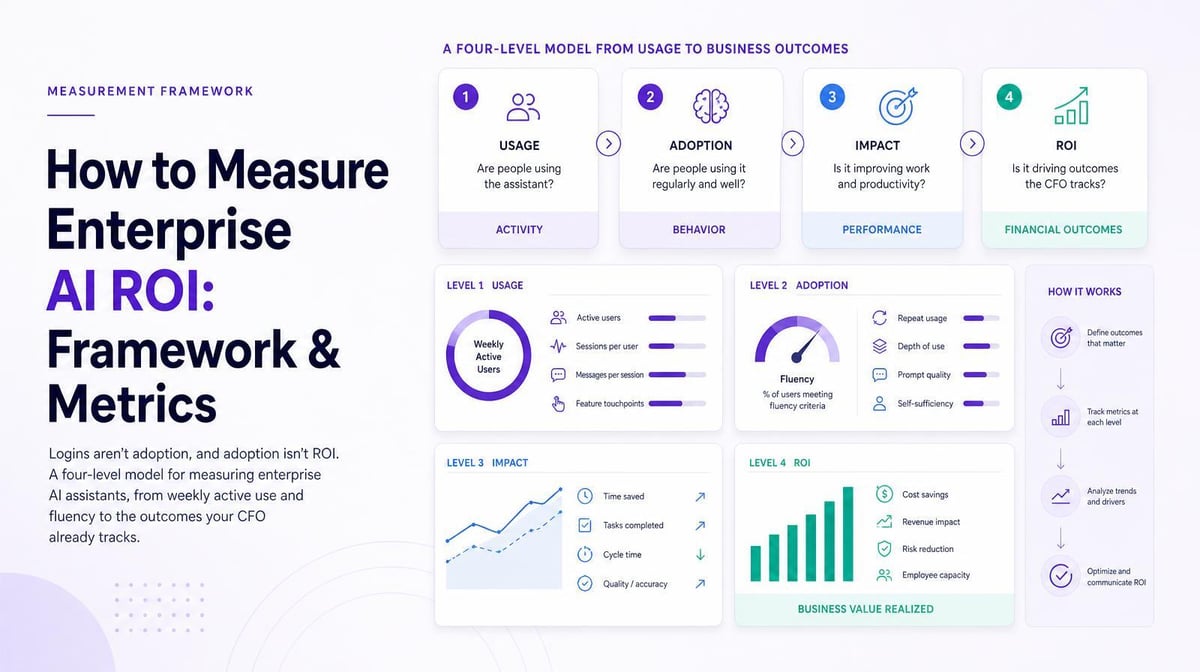
Measure an enterprise AI assistant at four levels: adoption (who uses it and how often), fluency (how well they use it), workflow impact (which tasks got faster or better), and business outcomes (what moved in the numbers leadership already tracks). Most companies stop at level one because that’s where the vendor dashboard stops. Adoption proves the rollout happened. ROI needs usage connected to outcomes, team by team.
Quick Answers
If you’re asking… | Short answer |
|---|---|
How should I measure the ROI and adoption of an enterprise AI assistant? | Track weekly active use by team and role, measure fluency, then link high-fluency teams to changes in cycle time, throughput, or quality, and compare that value to total cost. |
What’s the best enterprise tool I can use to measure AI ROI? | One that sees usage across every AI tool your people use and ties it to outcomes. Larridin is built for that; a vendor’s admin console covers only its own product. |
What counts as adoption? | Repeated, task-level use every week. A login once a month is a license, and licenses are a cost line. |
Are employee surveys enough? | No. Response rates can drop as low as 5%, and people can misjudge their own AI speedup. |
Should You Measure Adoption or ROI First?
Measure adoption first because ROI on a tool nobody uses doesn’t tell you anything.
Define adoption tightly. The useful measures are weekly active users as a share of licensed seats, sessions per active user, the range of tasks people use it for, and how evenly use is spread across departments. Watch for parallel tools too. Employees licensed for one assistant often keep using another they prefer, and that usage should be included.
A rollout with 80% of seats active but one task type per user is shallow. A rollout with 50% active and wider task variety may offer a stronger foundation for ROI.
A broader AI transformation ROI framework connects adoption and fluency with workflow redesign and business outcomes.
Why Aren’t Vendor Dashboards and Surveys Enough?
Vendor dashboards see one product, and surveys measure perception, not behavior. For a broader comparison of measurement platforms, see Larridin's guide to enterprise AI ROI tools.
The perception gap is large. In a 2025 randomized trial, experienced open-source developers took 19% longer on tasks with AI tools and still estimated afterward that AI had sped them up by 20%. Self-reported time savings make a weak foundation for an AI ROI case your CFO and board will trust.
Surveys also go unanswered. The Larridin FAQ notes adoption surveys with response rates as low as 5%, which leaves you extrapolating from the most enthusiastic users.
How Do You Measure AI Assistant Fluency?
Fluency is how effectively people use the assistant, and it’s measured by task variety, depth of use, and improvement over time.
Two teams with identical active-user rates can get very different value. One drafts emails. The other runs analysis, summarizes contracts, and builds first-pass models. Larridin’s proficiency scoring and department-level analytics put that difference on one screen, so enablement budgets can go to the teams furthest behind instead of the loudest ones.
How Do You Connect Assistant Usage to ROI?
Use metrics each function already reports to compare outcomes between high-fluency and low-fluency teams and before versus after rollout.
Pick one outcome per function:
- Support: handle time and customer satisfaction
- Sales: cycle time and pipeline per rep
- Finance: days to close the books
- Engineering: durable, complexity-adjusted output
- Operations: process completion time
Larridin grades this evidence by fidelity. Faster delivery at stable quality is the strongest signal; faster business processes are medium; self-reported time saved is the weakest. Report the strongest level you can reach for each team.
Then run the math against full cost, including licenses, token usage, enablement time, and admin overhead:
total AI cost) ÷ total AI cost
Where AI Assistant Measurement Breaks, and How to Fix It
What you’re dealing with | What you need | How Larridin helps |
|---|---|---|
Vendor dashboard shows logins only | Usage across every assistant people use | A browser extension and desktop app detect approved and unapproved AI tools |
Survey data nobody trusts | Behavioral data with no survey fatigue | Continuous usage tracking replaces point-in-time surveys |
Same tool, very different results by team | Fluency by team and role | Proficiency scoring and department-level analytics |
Leadership asks what the rollout returned | Usage tied to business outcomes | Usage correlated with productivity and outcome metrics |
Key Takeaways
- Measure in four levels: adoption, fluency, workflow impact, business outcomes.
- Count weekly, task-level use as adoption; logins don’t qualify.
- Self-reported time savings overstate impact, so lead with behavioral data.
- Compare high- and low-fluency teams on metrics each function already tracks.
FAQs
How long before AI assistant ROI shows up?
Adoption and fluency signals appear within weeks. Outcome changes usually need a full quarter of usage against a pre-rollout baseline before the comparison holds up.
Should we cut licenses from low users?
Try enablement first, then reassign. A low user in a role with clear use cases is a training gap; a low user with no relevant tasks is a license to move.
Can we measure assistant usage without reading employee prompts?
Yes. Larridin processes most sensitive data in the browser and sends only summary statistics to its cloud, so you get usage patterns without prompt content.
Which teams should we measure first?
Start with teams that already track a clear outcome metric, such as support or finance. They give you a credible before-and-after story fastest.
Sources
- METR randomized trial on AI and developer productivity (2025)
- Larridin FAQ: survey response rates, fidelity levels, data handling
- Larridin AI Adoption and AI Fluency