
Enterprise AI Measurement Guide
AI Productivity
AI Productivity Score Trend Chart
How is AI Productivity Score changing over time across departments, AI tools, and usage tiers?
What it shows
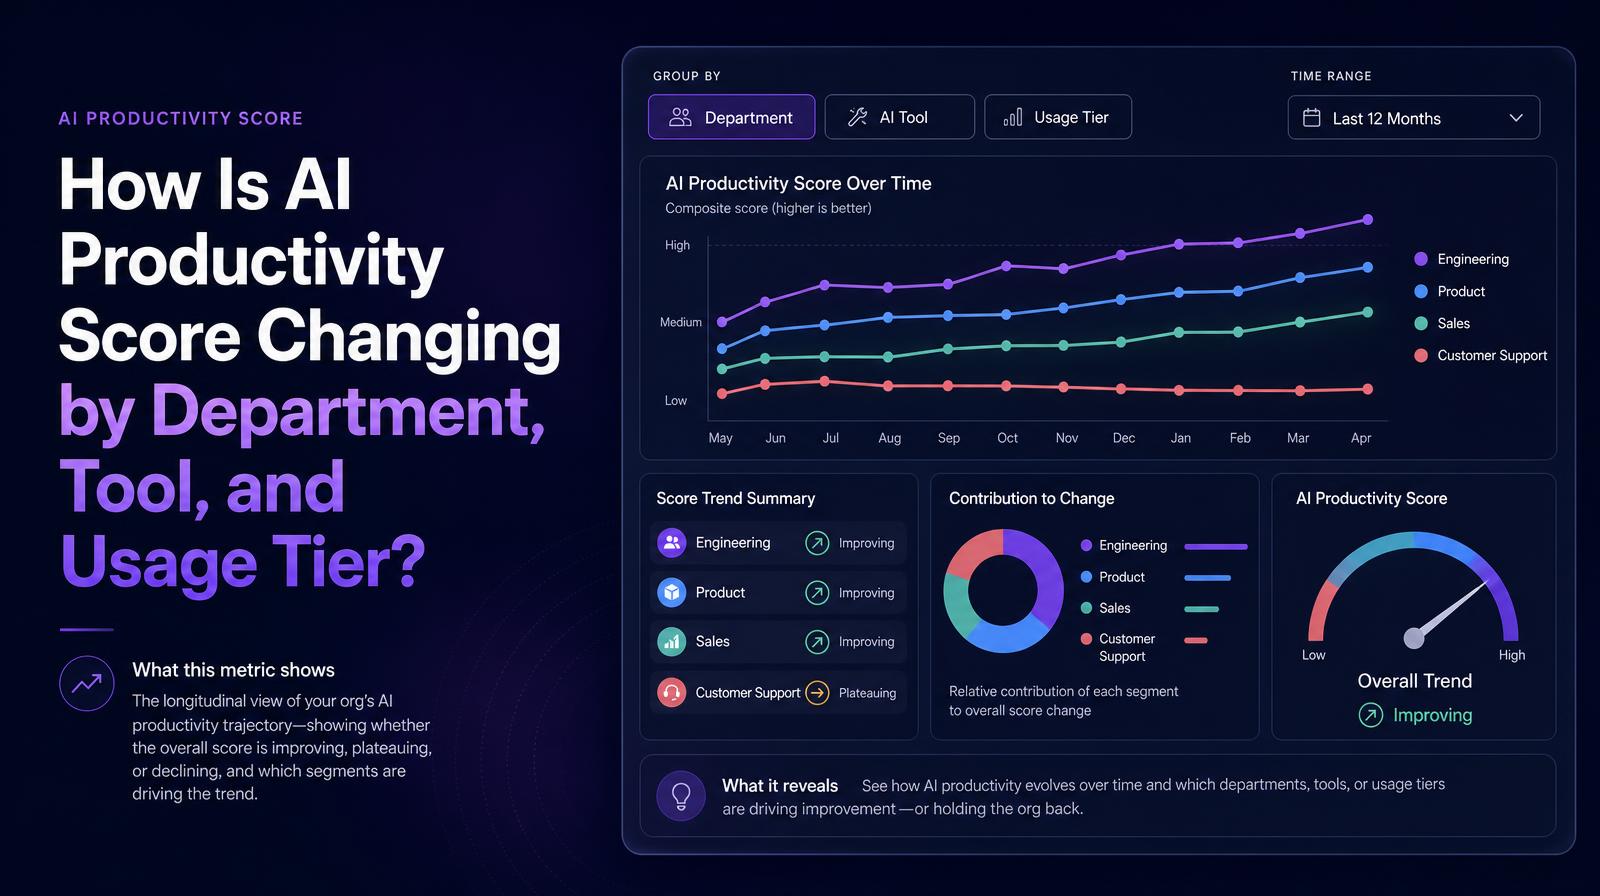
The AI Productivity Score trend chart plots the composite AI Productivity Score over time, with grouping options by Department, AI Tool, and AI Usage Tier. This is the longitudinal view of the org's AI productivity trajectory, showing whether the overall score is improving, plateauing, or declining, and which segments are driving the trend. The three grouping options let leaders diagnose whether productivity changes are broad-based or concentrated in specific departments, tool ecosystems, or user tiers.
Why it matters
The AI Productivity Score trend is the primary evidence layer for board and investor conversations about AI program value. A score that is rising consistently over quarters is the compounding capability story that justifies continued AI investment. A score that is flat despite rising AI adoption is the warning signal that investment is not translating into capability improvement, the most common outcome when enablement and workflow redesign don't accompany tool deployment. The Department and AI Tool groupings turn the trend from an org-level story into a targeted diagnostic.
The Larridin angle
The AI Usage Tier grouping, showing trend separately for Heavy, Medium, and non-users, is the most strategically useful view. A trend chart where Heavy users' scores are rising while Medium and non-users' scores stay flat confirms that the org has power users developing genuine AI proficiency but hasn't yet built the enablement infrastructure to spread those gains. That is a training and workflow design problem, not a tool problem, and the tier grouping makes the diagnosis unambiguous.
Related AI Productivity Metrics
Common questions
What does the AI Productivity Score trend chart show?
The chart displays the composite AI Productivity Score over time, grouped by Department, AI Tool, or AI Usage Tier, to highlight productivity trends within an organization.
Why is the AI Productivity Score trend important for the C-suite?
It serves as a key indicator for board and investor discussions, showing whether AI investments are translating into improved capabilities or if there's a need for better enablement and workflow redesign.
How can the AI Usage Tier grouping aid in diagnosing productivity issues?
It reveals whether productivity gains are limited to Heavy users, indicating a need for broader training and workflow design to spread AI proficiency across the organization.
What strategic insights can be gained from the Department and AI Tool groupings?
These groupings help identify whether productivity changes are widespread or concentrated, allowing leaders to target specific areas for improvement.