
Enterprise AI Measurement Guide
AI Productivity
AI Productivity Score Matrix
How do AI Productivity Scores compare across Light Users, Active Users, and Power Users by department, tool, or category?
What it shows
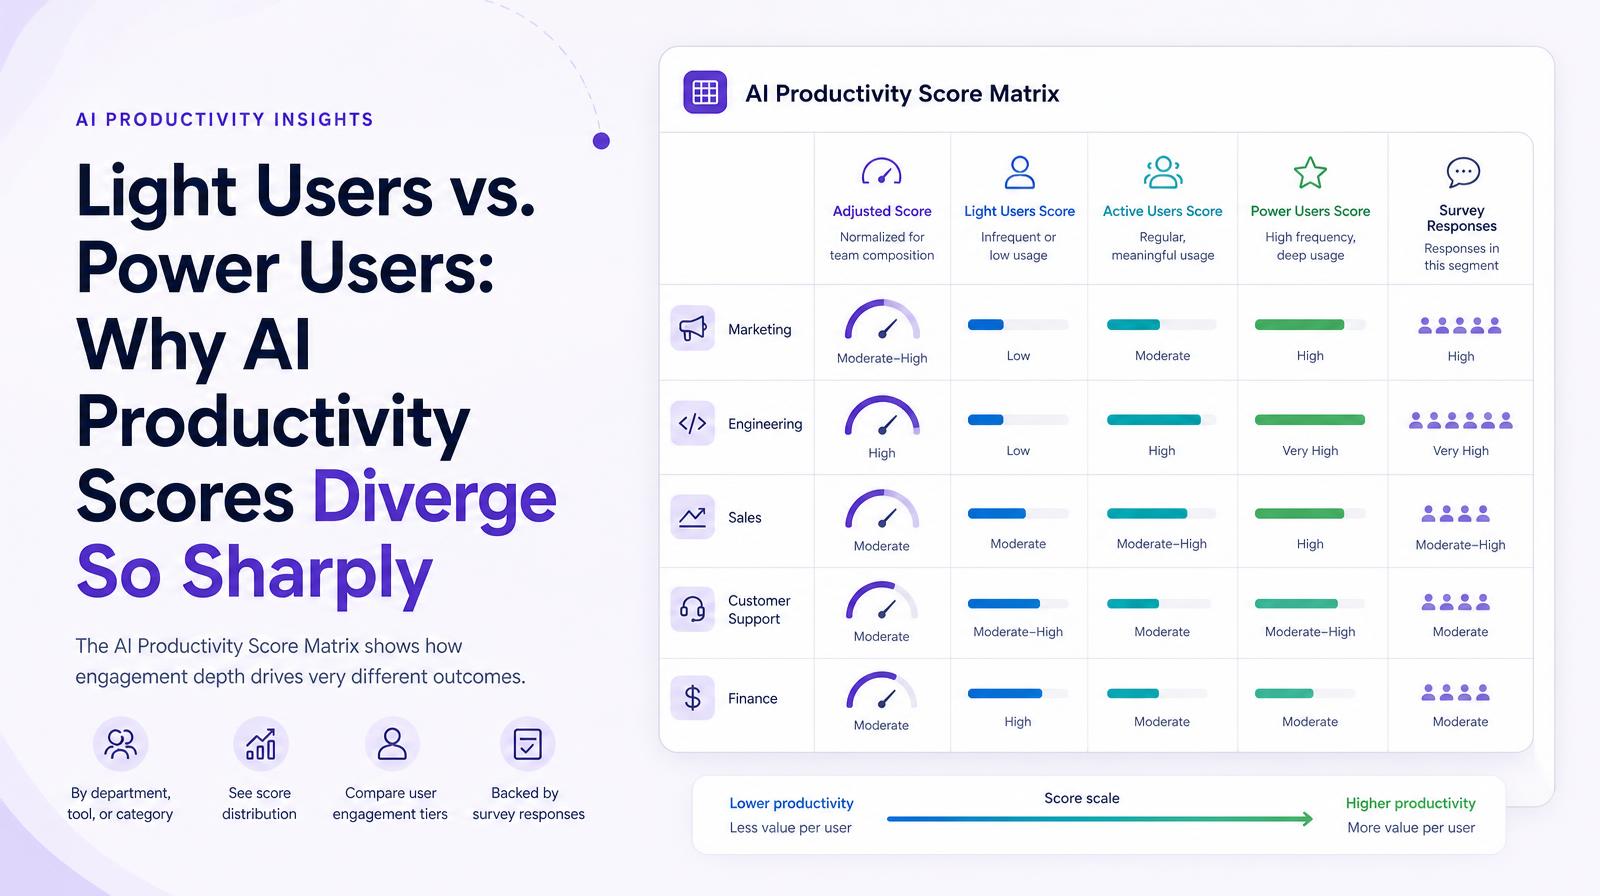
The AI Productivity Score Matrix shows the AI Productivity Score broken down into four columns for each department, AI tool, or category: Adjusted Score (normalized for team composition), Light Users Score, Active Users Score, and Power Users Score, alongside Survey Responses count for that segment. The matrix makes the productivity score distribution visible across the adoption tier spectrum, showing how much the score varies between users who barely use AI tools and those who use them intensively every day.
Why it matters
The productivity score gap between Light Users and Power Users is the most strategically significant number in the AI Productivity section. OpenAI enterprise research shows frontier workers (heavy AI users) saving 10+ hours per week and producing measurably higher-quality output than median users, a gap that exists within the same organization with identical tool access. The matrix quantifies that gap in Larridin's measurement framework: a Power Users Score of 78 alongside a Light Users Score of 31 is a 47-point gap that represents the productivity potential available if enablement successfully moves Light Users up the adoption curve.
The Larridin angle
The Survey Responses column gives each matrix cell a data quality indicator, a Power Users Score built from 3 survey responses is directionally useful but not statistically significant, while one built from 47 responses is a credible basis for investment decisions. Larridin includes the response count at the segment level so leaders know which productivity score differences are robust enough to act on and which require more data collection before drawing conclusions.
Related AI Productivity Metrics
Common questions
What is the AI Productivity Score Matrix?
The AI Productivity Score Matrix is a tool that breaks down AI productivity scores by department, AI tool, or category, showing scores for Light Users, Active Users, and Power Users, along with survey response counts.
Why is the gap between Light Users and Power Users significant?
The gap indicates the potential productivity gains if Light Users increase their AI tool usage, as Power Users typically save more time and produce higher-quality work.
How does Larridin ensure the reliability of the productivity scores?
Larridin includes survey response counts in the matrix to indicate data quality, ensuring leaders can gauge the robustness of the productivity scores before making decisions.
What strategic insights can the C-suite gain from the AI Productivity Score Matrix?
The matrix helps the C-suite understand productivity disparities within the organization and identify opportunities to enhance productivity by encouraging broader AI tool adoption.