


TL;DR
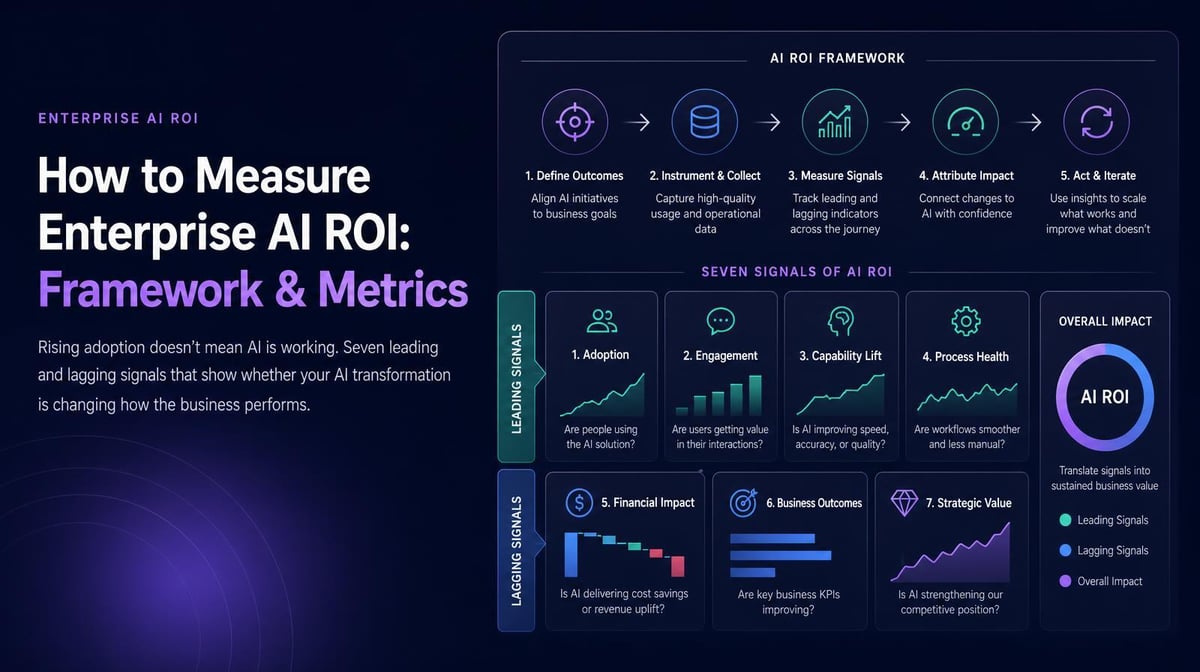
An AI transformation is working when seven signals move together: usage deepens, fluency rises across teams, shadow AI shrinks, redesigned workflows get faster, quality holds, cost per outcome falls, and business metrics improve against a pre-AI baseline. If adoption is the only number moving, the transformation hasn’t started paying off. Check leading signals monthly and lagging signals quarterly.
Quick Answers
If you’re asking… | Short answer |
|---|---|
How do we measure if our AI transformation is actually working? | Track seven signals against a baseline. It’s working when business outcomes improve while quality holds and cost per outcome falls. |
What’s the best enterprise tool I can use to measure AI ROI? | One that tracks adoption, fluency, workflows, spend, and impact on the same dataset. Larridin covers all five. |
What’s the earliest sign it’s working? | Usage depth: more task variety and more frequent use per active person, visible within weeks. |
What’s the clearest warning sign? | Adoption keeps rising while outcome metrics stay flat for two quarters. |
Which Signals Show an AI Transformation Is Working?
Seven signals, four leading and three lagging, give a reliable read on whether AI is changing how the business performs.
# | Signal | What to measure | When it shows | Warning sign |
|---|---|---|---|---|
1 | Usage depth | Task variety and sessions per active user | Weeks | Wide adoption, one task type per person |
2 | Fluency spread | Proficiency by team, gap between top and bottom teams | 1–2 months | Gap widening as champions pull ahead |
3 | Shadow AI share | Share of AI use in unapproved tools | 1–2 months | Unapproved use growing alongside approved tools |
4 | Workflow speed | Cycle time on redesigned workflows | 1–2 quarters | No workflow redesigned at all |
5 | Quality | Error rates, rework, customer satisfaction | 1–2 quarters | Speed up, quality down |
6 | Cost per outcome | AI and labor cost per unit of output | 1–2 quarters | Spend rising faster than output |
7 | Business outcomes | Revenue, margin, throughput versus baseline | 2–4 quarters | Flat after two quarters of strong adoption |
Signals one through four show whether the conditions for value are in place. Five through seven show whether those conditions produced measurable results.
For a broader reference, see Larridin's Enterprise AI Measurement Guide.
Why Isn’t Adoption Enough to Prove AI Is Working?
AI adoption shows that people are using the tools, but doesn’t establish whether work got better, faster, or cheaper.
MIT NANDA’s 2025 research described exactly this pattern across industries: adoption high, structural change low, with little structural transformation in most sectors. High login counts make a good launch metric and a poor success metric.
What Are the Warning Signs That It Isn’t Working?
The clearest warning signs are flat outcomes after strong adoption and spend that grows faster than output.
- Usage plateaus at shallow tasks such as email drafting
- One or two champion teams account for most meaningful use
- Outcome metrics stay flat for two quarters after rollout
- Rework and error rates climb as speed improves
- Survey enthusiasm increases with no change in behavioral data
What Should You Do When the Signals Disagree?
When signals don't align, investigate where the transformation may have stalled.
- Adoption up, outcomes flat: Workflows may not have been redesigned. Pick two processes and rebuild them around AI.
- Speed up, quality down: Review and testing capacity lagged. Invest there before scaling further.
- Spend up, output flat: Tools overlap or are underused. Consolidate and reclaim idle seats.
- Fluency gap widening: Enablement is reaching enthusiasts only. Target training at the bottom quartile of teams.
For ways to quantify the financial return, see 5 methods for measuring AI and analytics ROI.
How Often Should You Check the Signals?
Review leading signals monthly and lagging signals quarterly using a consistent baseline.
Capture the baseline before rollout if you can. If AI is already in place, use the earliest period with reliable data and disclose that it's a post-rollout baseline. Larridin tracks AI impact through usage, proficiency, workflow patterns, spend, and outcome data, so monthly reviews use current information instead of a quarterly scramble.
Where Transformation Tracking Breaks, and How to Fix It
What you’re dealing with | What you need | How Larridin helps |
|---|---|---|
Only adoption is tracked | Depth and fluency by team | Proficiency scoring and department-level analytics |
Shadow AI unknown | Share of use in unapproved tools | Detects approved and unapproved AI tools |
No proof workflows changed | Workflow-level visibility | Workflow Intelligence maps AI workflows and processes |
Leadership wants proof of value | Usage tied to outcomes and cost | Usage and spend correlated with productivity outcomes |
Key Takeaways
- 7 signals, 4 leading and 3 lagging, show whether AI is working.
- Adoption only proves the launch, nothing more.
- Disagreeing signals point to the stage that stalled.
- Review monthly and quarterly against one fixed baseline.
FAQs
How long until we know if our AI transformation is working?
Leading signals appear within weeks to two months. Expect two to four quarters before business outcome changes are clear enough to report with confidence.
Who should own the AI transformation scorecard?
One executive sponsor owns the scorecard, with a named owner for each signal. Finance should validate the cost and outcome numbers.
Can we compare our progress with other companies?
Yes, you can use the Larridin State of Enterprise AI report for context, but your own baseline is the comparison that matters most.
What if leadership wants a single number?
Give them cost per outcome or the primary business metric against baseline with the seven signals in an appendix.
For executive reporting, see how to build a defensible AI ROI case.
Sources
- MIT NANDA, The GenAI Divide 2025
- Larridin FAQ: proficiency scoring, detection, outcome correlation
- Larridin State of Enterprise AI