


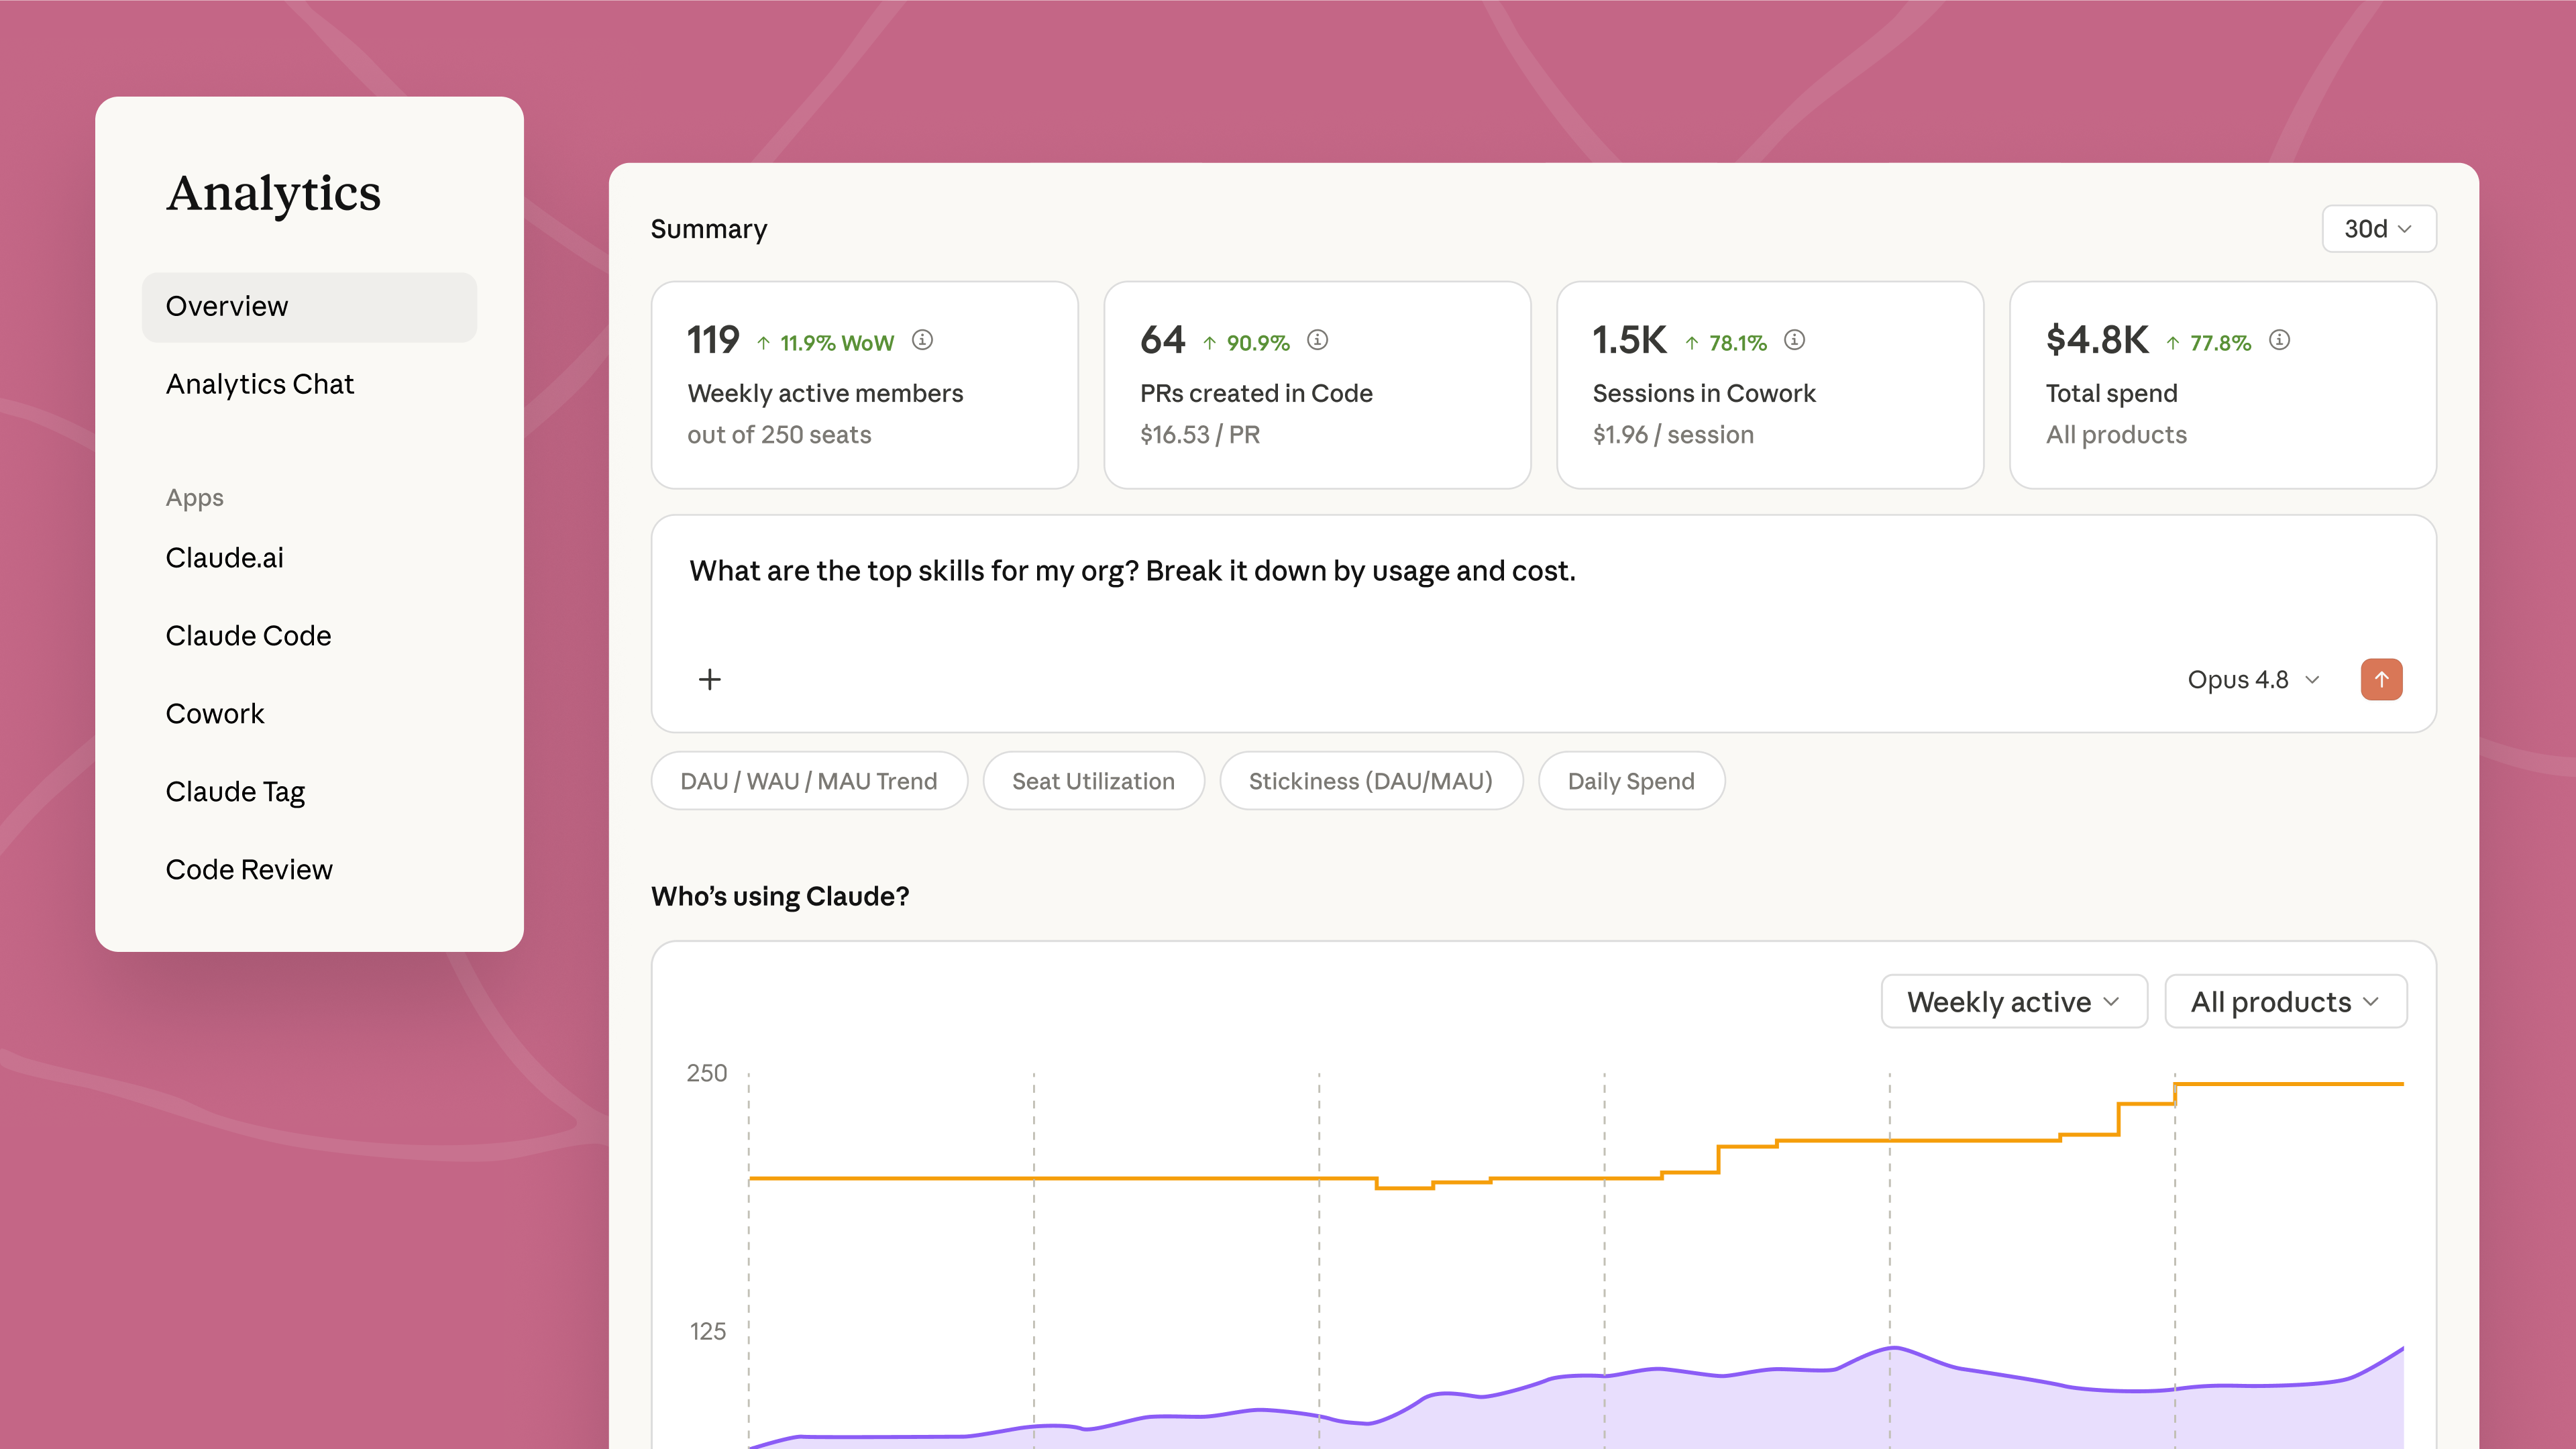
Image: Anthropic's announcement of the Enterprise usage analytics and cost controls launch.
If you own Claude analytics for your company, you need reliable answers to six questions:
- How much is Claude being used?
- How well is it being used?
- How fluently are people using it?
- Which features are being used?
- Which skills are being used?
- And what does all of it cost?
Here is the short answer, question by question. The rest of this guide is the detail.
| Question | What Claude Enterprise gives you | How to fill the gap |
|---|---|---|
| How much is Claude used? | Yes — dashboards plus the /summaries and /users endpoints | Covered natively |
| How well is it used? | Partly — accept rates, lines of code, PRs created; no merge, revert, or rework signal | Outcome integrations, via a DIY warehouse or Larridin |
| How fluently? | No — nothing in the stack measures it | OpenTelemetry depth signals, or Larridin fluency measures |
| Which features? | Yes — per-surface dashboards and API | Covered natively, for Claude only |
| Which skills? | Yes — /skills endpoint with per-skill cost | Covered natively, for Claude only |
| What does it cost? | Yes — per user, group, and model, with limits and alerts | Cross-vendor spend needs Larridin |
Claude Enterprise answers more of these natively than any other AI vendor's admin suite: dashboards organized around exactly these questions, a natural-language analytics chat, an 11-endpoint Analytics API, model entitlements, and a full spend-limit hierarchy. But the gaps are real, and worth knowing before you build a measurement strategy on it:
- Reporting doesn't align with your org chart unless you build and maintain SCIM groups that mirror it
- Fluency is never measured: Anthropic publishes an AI Fluency framework, but no metric in its analytics maps to it
- Usage is counted, outcomes aren't — there is no signal on whether the activity ships anything
- It all ends at Claude's edge, while your company also runs ChatGPT, Copilot, or Cursor
This guide covers all three layers: what comes out of the box, what you can build yourself on Anthropic's primitives, and how Larridin — which measures every AI tool in your company, not just Claude — closes those gaps. (On the Team plan instead? The analytics surface is much smaller — see our companion guide, How to Measure Claude Usage and Analytics on the Claude Team Plan.)
What Comes Out of the Box
The plan in question: Claude Enterprise starts at 20 seats, priced as a seat fee plus usage billed at API rates, which is exactly why per-user spend visibility matters from day one.
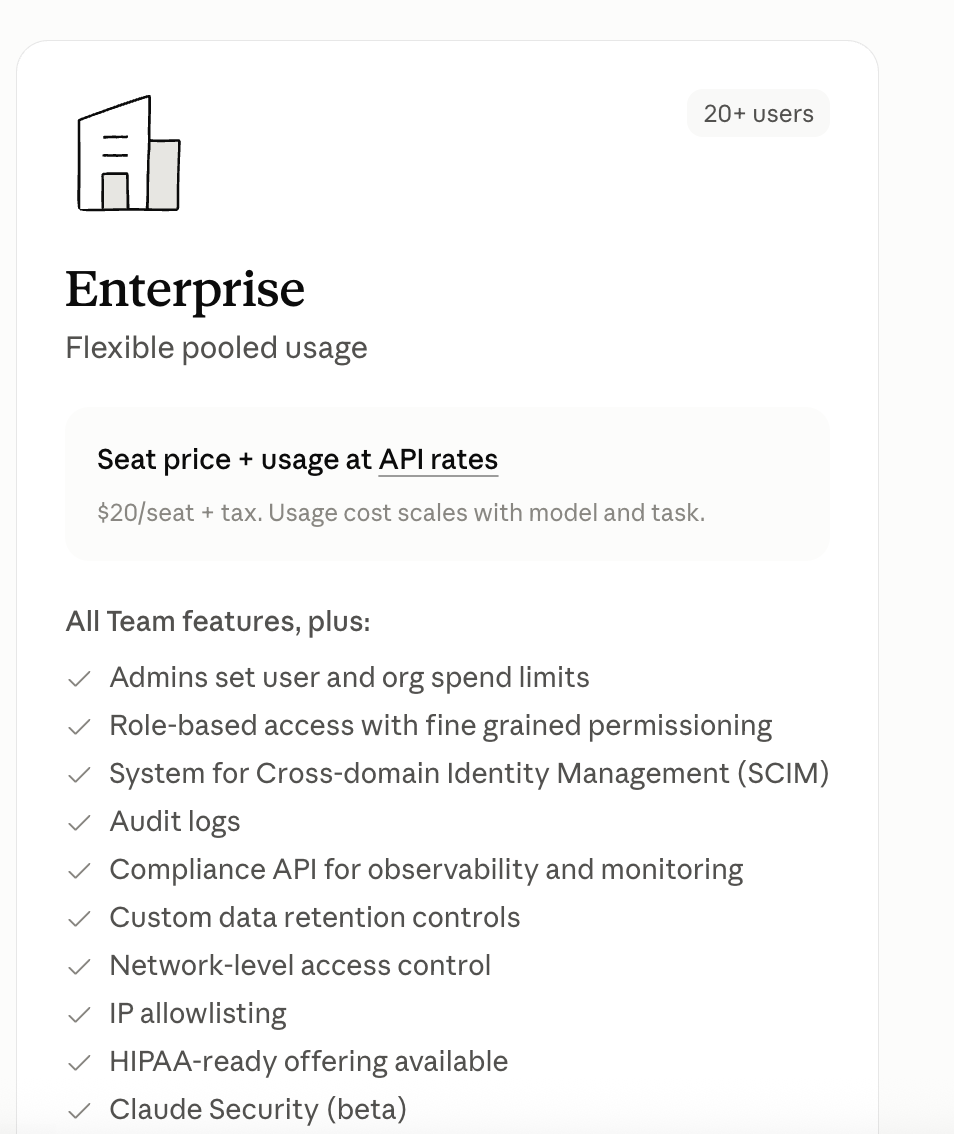
Image: Anthropic's Claude pricing page.
The admin dashboards (claude.ai → Analytics, substantially expanded in July 2026) are organized around four questions: who's using Claude, how, with what results, and at what cost.
- Overview — weekly active members, adoption level, product stickiness, and results metrics: PRs created, designs created, file operations, MCP writes, estimated time saved
- Chat — chats per day, share of active users, projects and artifacts created, top users
- Code — productivity (PRs and lines of code with Claude Code, acceptance rates, leaderboard), usage (skills adoption, MCP servers, tool usage, sessions by agent type), and value (estimated productivity lift, cost per commit, cost per PR, with formulas shown in-product)
- Design and Cowork — active users and session trends per surface
- Spend — totals by month, quarter, and year, spend by model, spend concentration, top spenders. Owners only; Enterprise Admins see every other tab
Granularity runs per-user and per-SCIM-group (up to 100 groups), with output metrics displayed next to their cost. Three operational details round it out. Analytics chat answers natural-language questions ("Which teams doubled usage this month?") against pre-aggregated usage data — 30-day default, 20 users per answer, daily refresh with a one-to-two-day lag. Spend alerts notify admins at 75% and 90% of org limits (users at 75% and 95%); they notify, they don't block. Model entitlements disable models org-wide or per role, set defaults, and cap effort levels. Individual members see their own usage by product, model, and skill at Settings → Usage.
The Analytics API
Enterprise is the only claude.ai plan with programmatic analytics. A Primary Owner creates an API key scoped to read:analytics, which unlocks eleven endpoints under /v1/organizations/analytics/:
| Endpoint | What it returns |
|---|---|
/summaries | Org-wide DAU/WAU/MAU, adoption rates against assigned seats, pending invites, per-product actives |
/users | The per-user activity cube: messages, conversations, projects, artifacts, Claude Code commits/PRs/sessions/LOC, tool accept-reject buckets, Cowork actions — per user per day |
/usage_report and /user_usage_report | Token usage, org-wide and per-user, groupable by model, product, and group |
/cost_report and /user_cost_report | Cost over time, org-wide and per-user |
/skills | Per-skill invocations, distinct users, enable counts, per-surface splits, and attributed spend per skill |
/connectors | Per-MCP-connector users, sessions per surface, and read/write/unclassified call counts |
/plugins | Install counts versus invocation counts per plugin |
/apps/chat/projects | Per-project activity |
/artifacts | Artifact creation by type and shared status |
Design around the constraints: 60 requests per minute per organization, data from January 2026 onward, daily aggregation with about a one-day lag, and cost figures revisable for up to 30 days. Claude Code routed through Amazon Bedrock never appears in this API, third-party plugins collapse into an anonymous bucket, and the Console-side Claude Code API names the same metrics differently (commits_by_claude_code there, commit_count here) — budget for that if you run both org types.
Where the Native Stack Stops

Illustration: Anthropic.
The suite counts artifacts of usage — sessions, invocations, tokens, dollars — and stops before interpretation. Six gaps matter in practice.
How your organization rolls up. Grouping goes exactly as far as your identity provider: per-user, or per-SCIM-group. Reporting lines and cost centers that don't live in the IdP as clean groups become a hand-maintained mapping, and Console orgs group by workspace instead — two schemes that never meet.
What people use Claude for. Analytics shows who uses Claude, how often, and at what cost, "but not what anyone said." There is no task classification for admins; analytics chat queries metrics, not content.
How fluently people use it. No turns per session, no prompt-quality signal, no plan-mode or subagent metrics. Anthropic's own 4D AI Fluency framework (Delegation, Description, Discernment, Diligence) is instrumented nowhere in the product — the vendor teaches fluency but doesn't measure it.
Whether the output survives. PR and commit metrics count creation, not survival: no merge rates, reverts, or rework. The productivity-lift figures are formula projections, which is why they need pairing with delivery metrics built for the agent era and a real output measure.
Whether the plumbing works. The connectors endpoint counts calls but carries no failure rates or latency. A connector failing half its calls and one working perfectly look identical.
Anything that isn't Claude. ChatGPT Enterprise, Copilot, and Cursor each keep their own silo, none comparable in one place.
Building It Yourself
Enterprises that need more combine three Anthropic surfaces: the Analytics API feeding a warehouse, Claude Code's OpenTelemetry export for real-time per-tool depth (including the only native MCP failure signal), and Compliance API session transcripts as raw material for custom classification. The primitives are good. The cost is three ingestion pipelines with different schemas, lags, and privacy postures, plus permanent maintenance as they evolve — and the result still ends at Claude's edge, so the same build is owed again for every other AI vendor in the org.
Larridin: One Layer Across Every AI Tool
Larridin is the platform version of that build, with one structural difference: it was never a Claude dashboard.
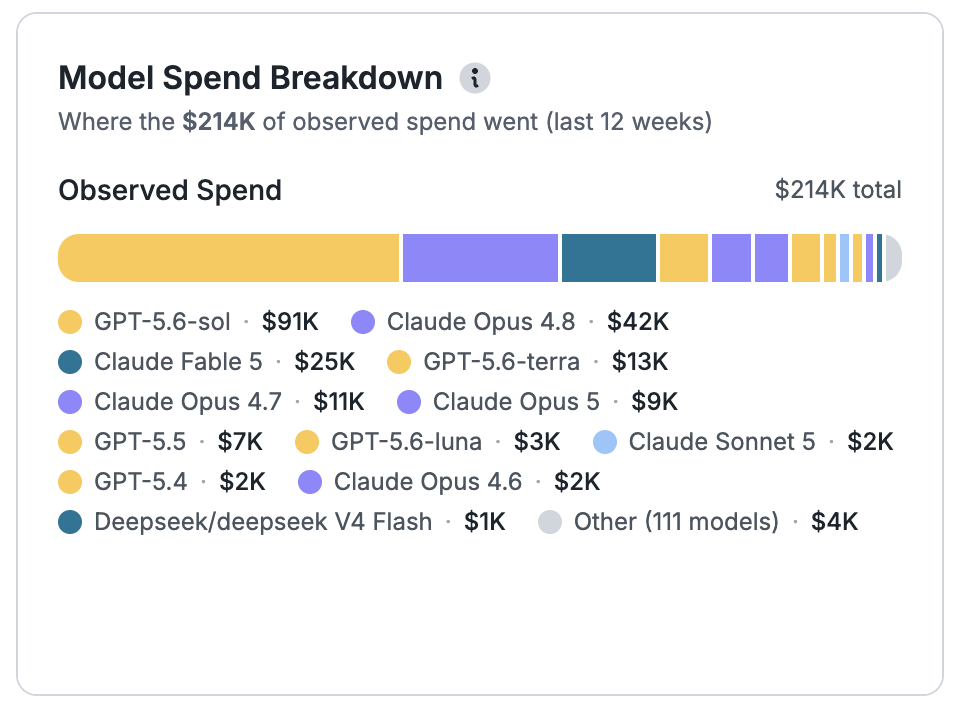
That is one organization's observed spend across twelve weeks: GPT, Claude, and over a hundred other models in a single view. No vendor's native analytics can draw this chart, because each one only sees itself. (A scope note: Larridin reports observed spend at the model and tool level, not per-request billing — invoices remain the accounting source of truth.)
The gaps above close the same way. Larridin tracks tool calls and per-MCP-server failure rates, the reliability signal the Analytics API doesn't carry. It captures session-level configuration — which models, MCP servers, plugins, and skills each session actually used — without an OpenTelemetry build-out. And adoption rolls up by capability:
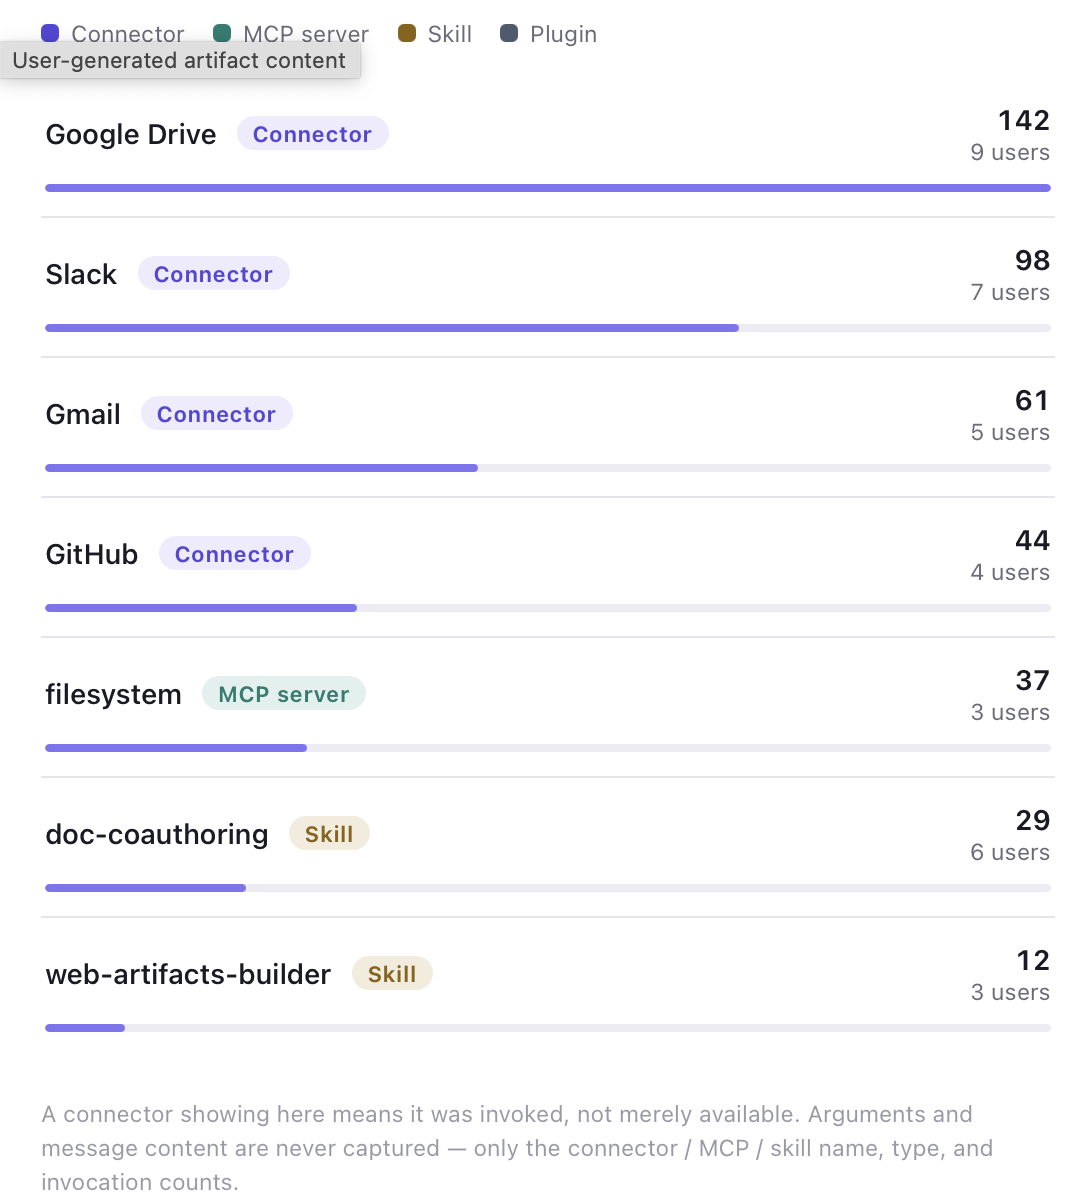
A capability appears there because it was invoked, not merely available. Arguments and message content are never captured — only names, types, and counts — the same metadata-only posture as Anthropic's own analytics, so adding Larridin doesn't change your privacy story.
Where the native stack counts, Larridin interprets: adoption depth and fluency per person and team, mapped to how your organization actually rolls up rather than to IdP groups, and connected through 200+ integrations to delivery outcomes — so engineer-agent effectiveness and token cost effectiveness are measured against what ships, not against activity counts.
Choosing a Route
| Dimension | Claude Enterprise native | DIY (API + OTel + Compliance) | Larridin |
|---|---|---|---|
| Setup effort | None | Three pipelines + warehouse + upkeep | Deploys in hours |
| Per-user usage and cost | Yes | Yes | Yes (observed, model/tool level) |
| Org-chart rollup | Only via SCIM groups | Build the mapping yourself | Yes |
| MCP failure rates | No | OTel only | Yes |
| Interaction depth / fluency | No | Build it yourself | Yes |
| Task/outcome interpretation | No | Build it yourself | Outcome-connected via integrations |
| Real-time | No (daily, 1–2 day lag) | OTel portion only | Yes |
| Beyond Claude | No | No | ChatGPT, Copilot, Cursor, and more |
For a Claude-only question, the native suite is excellent, and this guide should help you get everything out of it. For "how is AI adoption actually going across this company," you need one answer that spans every vendor and carries the reliability and fluency signal vendor dashboards don't. That is what Larridin is built for.
FAQ
Does Claude Enterprise have an analytics API?
Yes — it is the only claude.ai plan with one: eleven endpoints under /v1/organizations/analytics/ covering adoption, per-user activity, usage, cost, skills, connectors, plugins, projects, and artifacts, at 60 requests per minute per org, with data from January 2026 onward.
Can Claude admins see what tasks people use Claude for? No. Enterprise analytics shows who uses Claude, how often, and at what cost — never conversation content or task categories. Task-level understanding requires building on Compliance API transcripts or measuring outcomes through a platform.
Can I see MCP failure rates in Claude Enterprise analytics? No. The connectors endpoint reports call counts and users, not failure rates or latency. Native failure signal exists only in Claude Code's self-hosted OpenTelemetry export. Larridin tracks per-MCP-server tool calls and failure rates as a managed capability.
How do Claude spend limits work on Enterprise? As a hierarchy: per-user overrides, then seat-tier or group limits, then the org default, with admin alerts at 75% and 90% of org limits and user notifications at 75% and 95%. Model entitlements add a second lever by restricting expensive models per role or org-wide.
How do I measure Claude alongside ChatGPT and Copilot? Not with vendor analytics — each ends at its own products. Larridin measures adoption, observed spend, fluency, and outcomes across Claude, ChatGPT, Copilot, Cursor, and more in one place.