


Image: Anthropic.
If you own Claude analytics for your company, you need reliable answers to six questions:
- How much is Claude being used?
- How well is it being used?
- How fluently are people using it?
- Which features are being used?
- Which skills are being used?
- And what does all of it cost?
Here is the short answer for the Team plan, question by question. The rest of this guide is the detail.
| Question | What the Team plan gives you | How to fill the gap |
|---|---|---|
| How much is Claude used? | Yes — admin dashboard: members vs seats, daily actives, sessions | Covered natively |
| How well is it used? | Partly — accept rate, lines of code, PR attribution (conservative, Claude Code only) | Outcome measurement via DIY OpenTelemetry or Larridin |
| How fluently? | No | OpenTelemetry signals, or Larridin fluency measures |
| Which features? | Product-level activity counts only | Larridin session-level configuration |
| Which skills? | No — skill, plugin, and MCP analytics are Enterprise-only | OpenTelemetry (with detail logging), or Larridin |
| What does it cost? | Overage spend only — usage inside seat allowances isn't metered in dollars | Larridin observed spend, across all AI vendors |
The Team plan covers more than most admins expect, including a full Claude Code analytics view with acceptance rates and PR attribution. But there is no analytics API, no skills, plugin, or MCP visibility, and no model controls. This guide covers all three routes: what comes out of the box, what you can build yourself on Claude Code's OpenTelemetry export, and how Larridin answers the questions the native surface can't.
One scoping note before the details: Claude analytics is fragmented across account types. A claude.ai Team or Enterprise organization and a Claude Console (API) organization are separate accounts with separate dashboards, even under the same email. This article covers the claude.ai Team plan; if your developers use Claude Code through API keys instead of Team seats, your data lives in the Console, with different tooling. Claude Code's self-hosted OpenTelemetry export is the third measurement surface, independent of either org type and the only real-time one — it is the backbone of the DIY route below.
What the Team Plan Gives You Natively
The plan itself spans 2–150 users on Standard and Premium seats, and every analytics surface described here comes included regardless of seat mix.
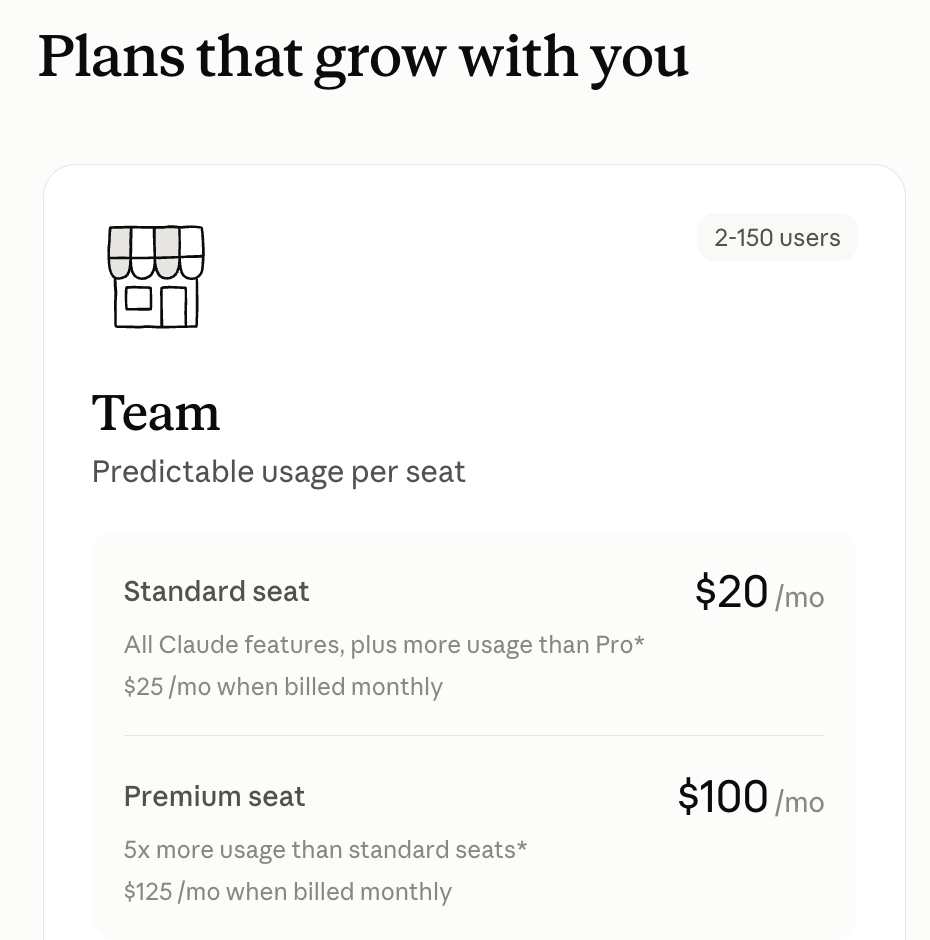
Image: Anthropic's Claude pricing page.
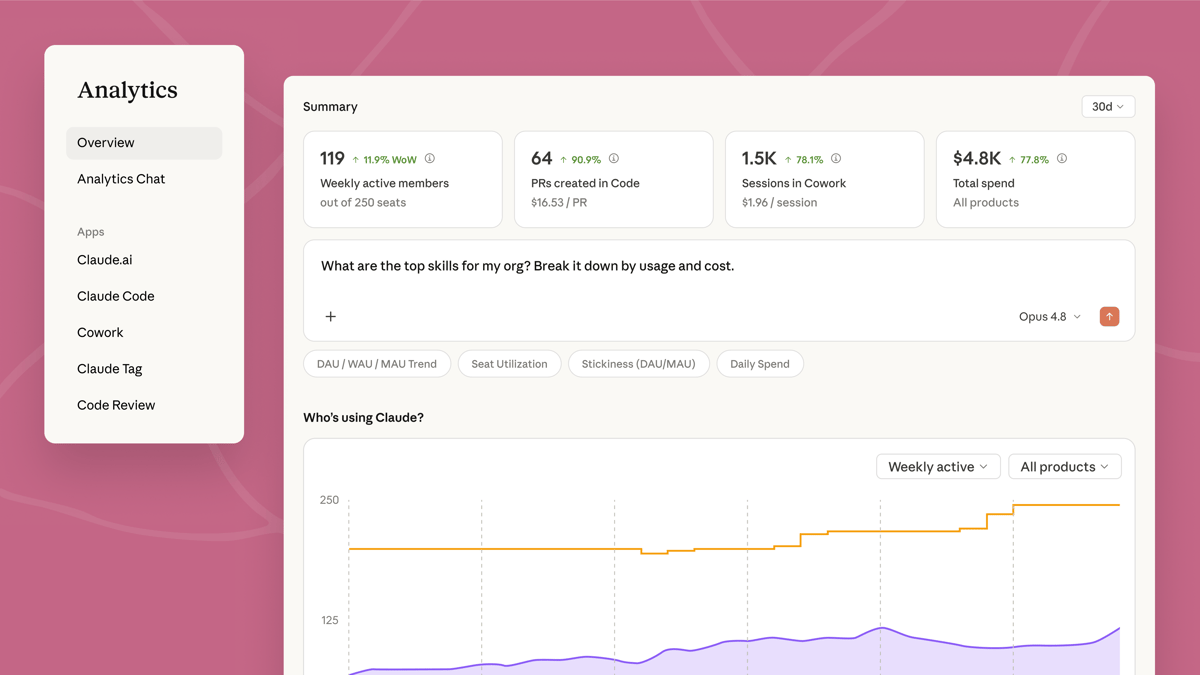
Team plan Owners and Primary Owners get an Analytics view that answers the first-order questions: active members versus assigned seats, product-level activity, and month-to-date spend by user, with a spend report CSV broken down by user and model.
The stronger surface is the Claude Code analytics dashboard, which is included on Team — a common misconception is that it requires Enterprise. It shows:
- PRs with Claude Code — merged pull requests containing at least one line written with Claude Code, attributed through a GitHub app integration that labels merged PRs
claude-code-assisted - Lines of code with Claude Code — counting only "effective lines" (more than three characters, excluding bracket-only lines and generated files)
- Suggestion accept rate — the share of accepted code-editing suggestions across the Edit, Write, and NotebookEdit tools
- Adoption charts — daily active users and sessions per day, plus PRs per user
- A leaderboard — top contributors by PRs or lines of code, with a full-organization CSV export
Three built-in caveats matter when you report these numbers upward. First, Anthropic describes its PR attribution as "deliberately conservative… an underestimate": only high-confidence matches count, code that developers rewrite by more than 20% is excluded, and matching only considers sessions from 21 days before to 2 days after the merge. Second, usage metrics reset every calendar month, so there is no native way to look at a quarter. Third, if your organization runs Zero Data Retention, contribution metrics are unavailable entirely.
On cost: Team spend reporting only meters dollars for usage beyond the seat allowance. Usage inside the seat allotment "isn't metered in dollars" at all, which means the spend CSV understates true consumption on any team that mostly stays within its seats. Admins can set org-wide and per-user monthly limits on extra usage credits, and members see their own five-hour and weekly limit bars in Settings.
The Team Plan Ceiling
Everything below exists in Anthropic's product — but only on the Enterprise plan. On Team, these are simply not available at any price short of upgrading:
| Capability | Team | Enterprise |
|---|---|---|
| Analytics API (programmatic export) | No | Yes — 11 endpoints |
| Analytics chat (natural-language queries) | No | Yes |
| Per-skill usage and cost analytics | No | Yes |
| Plugin install/invocation analytics | No | Yes |
| MCP connector usage (read/write calls) | No | Yes |
| Groups and group spend limits | No | Yes |
| Model access controls and default models | No | Yes |
| Custom roles | No | Yes |
Everything in that right-hand column is covered in depth in our companion guide, How to Measure Claude Usage and Analytics on Claude Enterprise.
The demand for these on Team is visible in public feature requests — Team-plan skill analytics has open GitHub issues against the Claude Code repository. And even where dashboards exist, the data refreshes daily with a one-to-two-day lag. Nothing native is real time.
If the questions you need answered stop at "who is active and what does overage cost," the native surface is enough. The moment you ask "which MCP servers do we depend on," "who has actually learned to use skills," or "what is our acceptance rate trend by team," you need one of the two routes below.
The DIY Route: OpenTelemetry
Claude Code ships a full OpenTelemetry export — the only Anthropic surface that is real time, and the only one available identically on every plan. Setting CLAUDE_CODE_ENABLE_TELEMETRY=1 (rolled out org-wide through a managed settings file) makes every Claude Code client emit 8 metrics and 22 event types to a collector you run.
What you gain over the native dashboard:
- Every tool call, with accept/reject decisions and the source of each decision (user, config, or hook) — not just the three file-editing tools
- Tool failures, with error types and durations
- MCP server connections, including failures — the only place in the Claude ecosystem where MCP failure signal exists at all
- Skill activations, including whether a skill was invoked deliberately or triggered proactively
- Model, effort, and fast-mode choices per request, and cost approximations attributable per user, session, skill, or MCP server
- Session depth and active time — how long engineers actively work with the agent versus letting it run
The costs are concrete too. You are now operating a telemetry pipeline: an OTLP collector, storage, dashboards, and maintenance as Claude Code's schema evolves. Names are redacted by default — custom skills report as custom_skill, third-party plugins as third-party, and MCP tools as the literal string mcp_tool — until an admin enables detailed logging, which is a privacy decision worth making deliberately. The telemetry covers Claude Code only; claude.ai chat usage never appears. And the cost figures are approximations for analytics, not billing data.
Community dashboard templates exist for Grafana, SigNoz, and Datadog, and Anthropic publishes an official monitoring guide. Plan on real engineering time regardless: the teams that get value from this route treat the pipeline as an internal product.
The Platform Route: Larridin
The third option is a measurement platform that collects this depth for you — which is what we build at Larridin. Two differences from both routes above are worth being precise about.
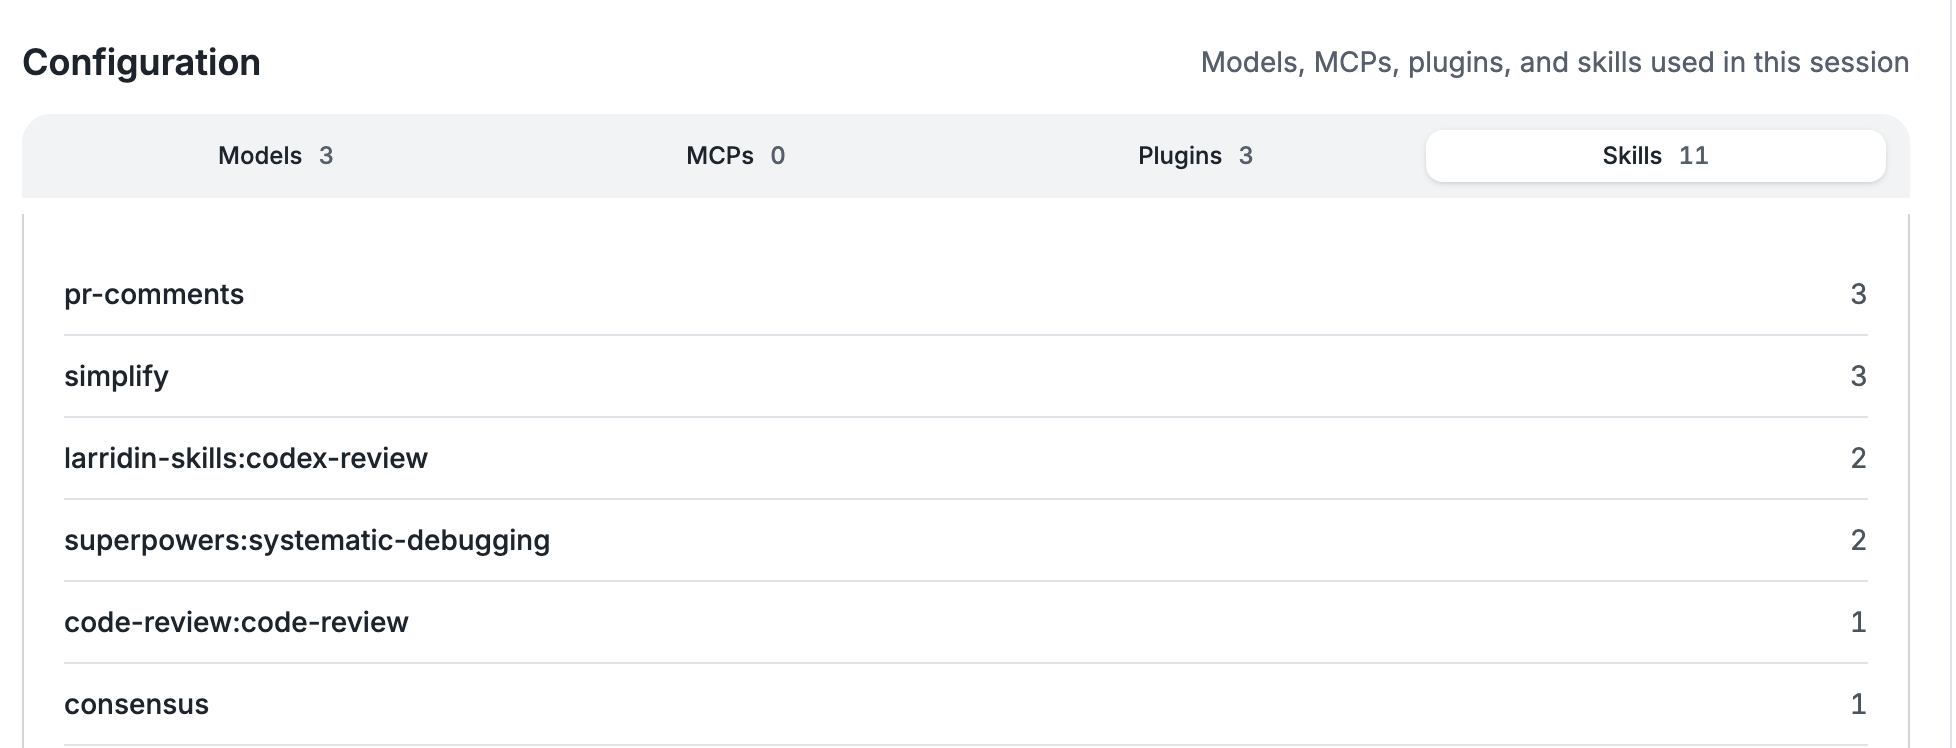
First, the depth arrives without the pipeline. Larridin shows the configuration of every session — which models, MCP servers, plugins, and skills were actually used, per session, per engineer:
The same applies to MCP dependence — tool-call volume by server, alongside failure rates, so you can see both which connectors your team relies on and which ones are quietly breaking:
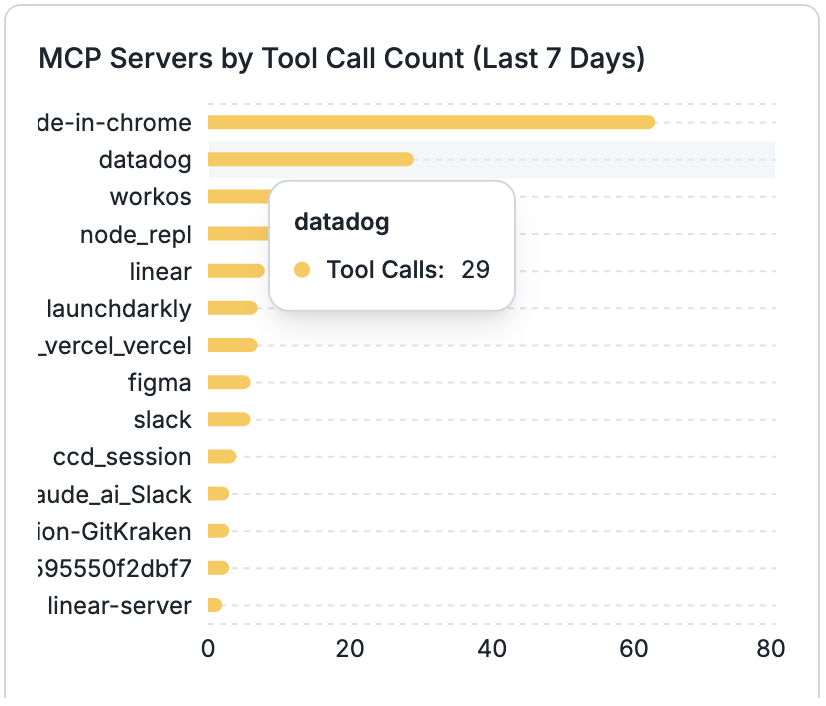
On the Team plan, none of this is visible natively at all; with DIY OpenTelemetry it is visible only after you build and maintain the pipeline and opt into detailed logging.
Second, Larridin is not a Claude dashboard. Your engineers do not only use Claude. The same organization typically runs ChatGPT or Codex, GitHub Copilot, and Cursor side by side, and each vendor's analytics stops at its own edge. Larridin measures adoption, usage depth, and fluency across all of them in one place, so "how is AI adoption going" stops being four dashboards and a spreadsheet. Spend is part of the same picture: Larridin reports observed spend at the model and tool level across vendors (it does not attempt per-request billing reconciliation — your invoices remain the source of truth for accounting).
That cross-tool view is what turns usage data into decisions: which tool earns the renewal, where token spend concentrates, and which teams have changed how they work versus installed something new.
Choosing a Route
| Dimension | Claude native (Team) | DIY OpenTelemetry | Larridin |
|---|---|---|---|
| Setup effort | None | Collector, storage, dashboards, maintenance | Deploys in hours |
| Real-time | No (daily, 1–2 day lag) | Yes | Yes |
| Tool calls & failures | Accept rate for 3 edit tools | All tools, all decisions | All tools, all decisions |
| Skills / plugins / MCP visibility | None on Team | Yes, with config effort | Yes, per session |
| MCP failure rates | None | Connection failures | Tool calls and failure rates per server |
| Programmatic access | None on Team | Your own data | Yes |
| Coverage beyond Claude Code | Chat activity counts | None | ChatGPT, Copilot, Cursor, and more |
| Cross-tool comparison | No | No | Yes — one dashboard across vendors |
A reasonable path for many teams: use the native dashboard for seat and adoption hygiene, and add either the DIY pipeline (if you have platform engineers with capacity and only care about Claude) or Larridin (if you want the depth without the build, across every AI tool you run). The native dashboards and a platform are complementary — one is your vendor's view, the other is yours.
FAQ
Does the Claude Team plan have an analytics API? No. Anthropic's Enterprise Analytics API is not available on the Team plan. Team admins get dashboards and CSV exports only. Programmatic access to Claude usage data on Team requires either building on Claude Code's OpenTelemetry export or using a third-party platform.
Can I see which skills or MCP servers my team uses on the Team plan? Not natively. Per-skill, per-plugin, and per-connector analytics are Enterprise-only. On Team, that visibility requires OpenTelemetry (with detailed logging enabled) or a platform like Larridin, which shows models, MCP servers, plugins, and skills used per session.
How do I track Claude Code usage in real time? Native dashboards refresh daily with a one-to-two-day lag on every plan. The only real-time options are Claude Code's OpenTelemetry export (self-hosted) or a platform that collects live telemetry for you.
Is the Claude Code analytics dashboard accurate? It is deliberately conservative. Anthropic documents its PR attribution as an underestimate: only high-confidence matches count, developer rewrites above 20% are excluded, and Zero Data Retention organizations get no contribution metrics at all. Treat the native numbers as a floor, not a measurement of full impact.
Can I measure Claude and ChatGPT usage together? Not with either vendor's native analytics — each stops at its own products. Cross-tool measurement (Claude alongside ChatGPT, Copilot, Cursor, and others) is the core of what Larridin provides: one view of adoption, spend, and fluency across every AI tool in the organization.