
Enterprise AI Measurement Guide
CI/CD
Deploy Outcomes Chart
How many production deployments are succeeding versus failing over time, and how does that volume relate to the Change Failure Rate?
What it shows
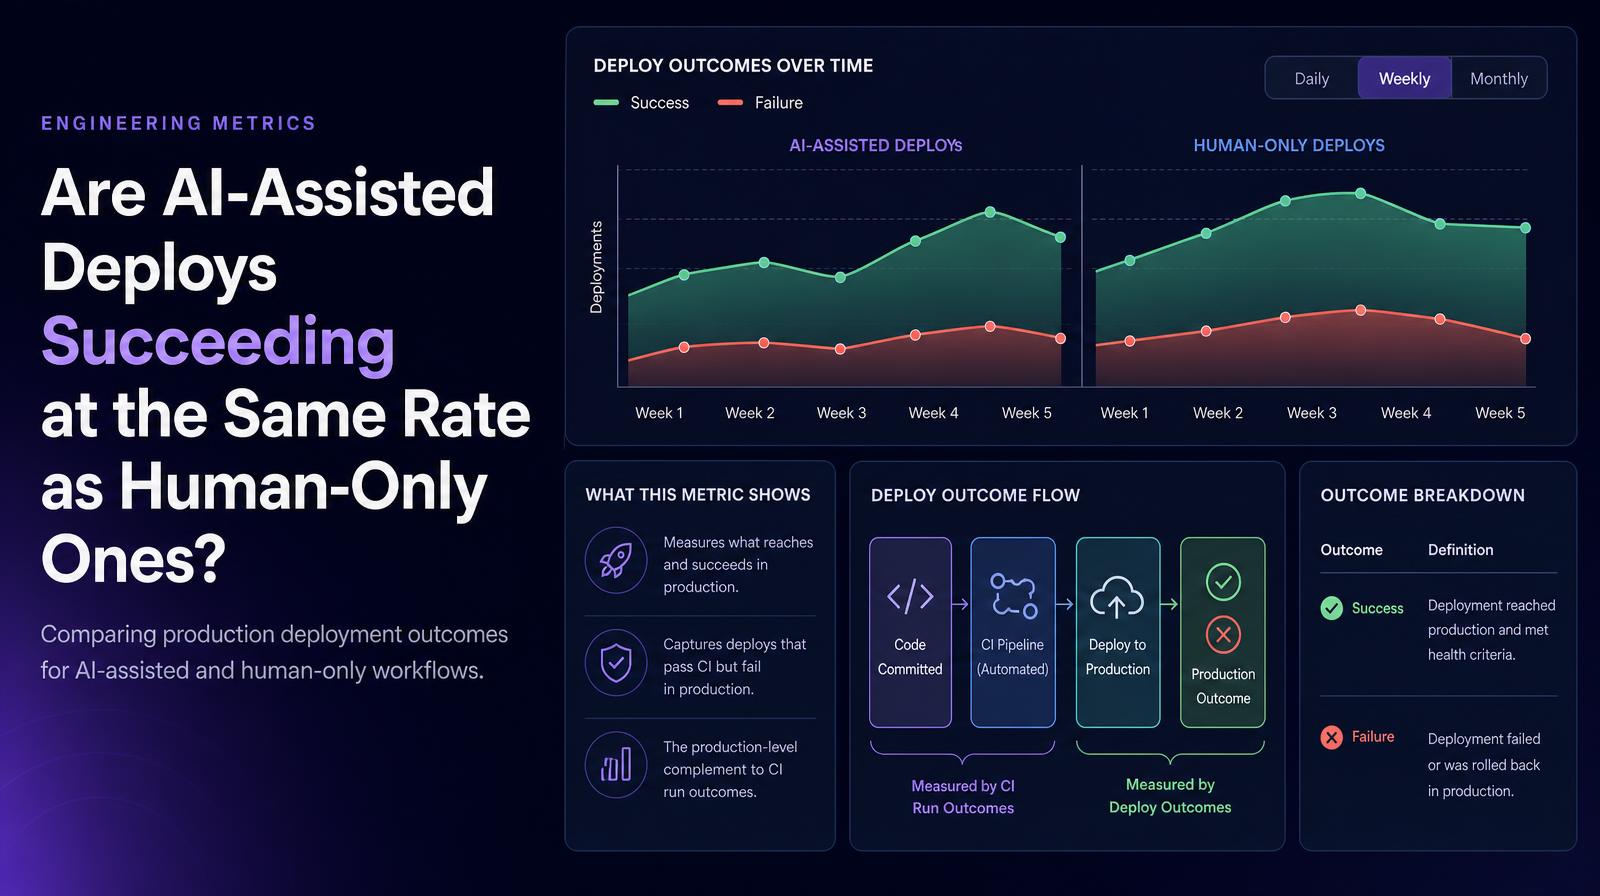
The Deploy Outcomes chart shows the count of production deployments over time split between Success and Failure outcomes, the production-level complement to the CI Run Outcomes chart. Where CI outcomes measure the automated pipeline, Deploy Outcomes measure what actually reaches and succeeds in production. A deployment that passes CI but fails in production is captured here but not in the CI metrics, making Deploy Outcomes the final quality gate measurement.
Why it matters
Deploy Outcomes is the production accountability metric. CI success means the code passed automated tests; deploy success means it actually worked in production. The gap between the two, code that passes CI but fails in production, is where the most damaging quality failures hide. In AI-assisted engineering environments where agent-generated code often lacks the context to anticipate production-specific edge cases, this gap can widen as agent adoption grows. The Deploy Outcomes chart makes that widening visible over time rather than discoverable only after an incident.
The Larridin angle
Read alongside Change Failure Rate (which measures the percentage of deploys that fail) and Deploy MTTR (which measures recovery speed), the Deploy Outcomes chart adds the volume context, whether the absolute number of failures is rising, falling, or stable even as the rate changes. Percentage metrics can mask absolute-count trends when deployment volume is growing rapidly.
Related CI/CD Metrics
Common questions
What does the Deploy Outcomes chart measure?
The Deploy Outcomes chart measures the count of production deployments over time, distinguishing between Success and Failure outcomes.
Why is the Deploy Outcomes metric important for the C-suite?
Deploy Outcomes is crucial as it reflects production accountability, highlighting the gap between CI success and actual production success where quality failures can occur.
How does AI-assisted deployment affect production success rates?
AI-assisted deployments can widen the gap between CI success and production success due to potential lack of context in agent-generated code, making production-specific failures more likely.
How does the Deploy Outcomes chart complement other metrics?
It adds volume context to Change Failure Rate and Deploy MTTR by showing absolute failure counts, which can reveal trends masked by percentage metrics.