
Enterprise AI Measurement Guide
Unified Analytics
AI Usage Trends Chart
Which AI tools are gaining or losing users over time, and how do their trends compare?
What it shows
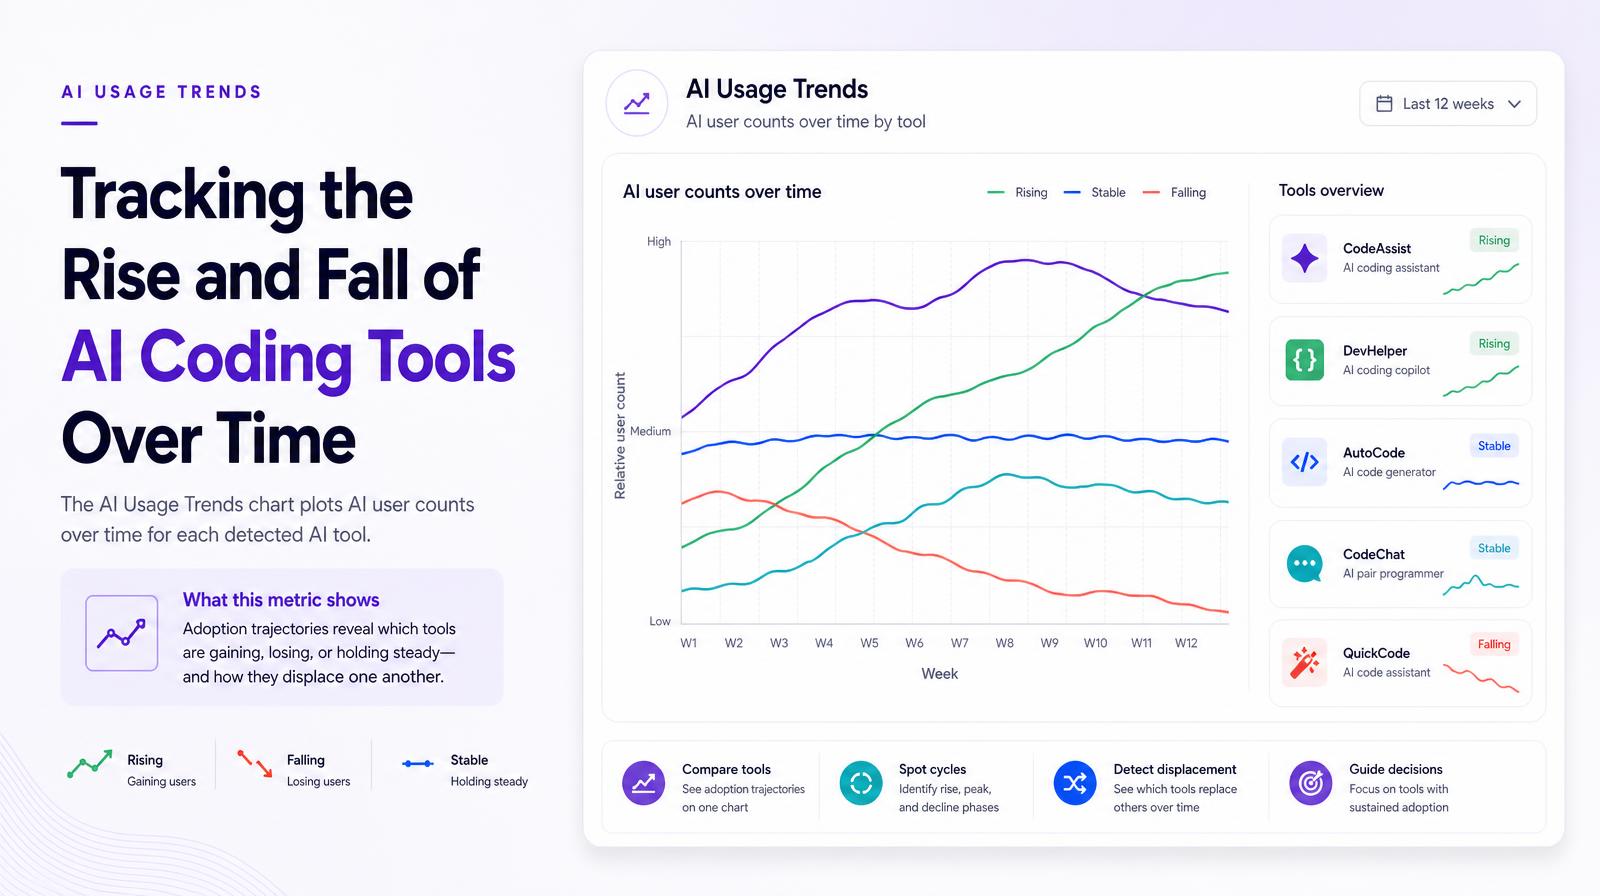
The AI Usage Trends chart plots AI user counts over time for each detected AI tool, showing the adoption trajectory of every tool in the environment on the same chart. Tools gaining users appear as rising lines; tools losing users appear as declining lines; tools with stable adoption appear flat. The multi-tool, multi-week view reveals tool adoption cycles, displacement events (one tool rising as another falls), and the overall direction of the AI tool portfolio.
Why it matters
Tool adoption trends are the leading indicator for portfolio decisions. A tool where user count has been declining for six weeks is unlikely to recover without intervention, whether that intervention is a new enablement program, a pricing change, or a governance decision to redirect users to a better alternative. A tool where user count is accelerating alongside another tool's decline may represent an organic migration happening without IT oversight. The trends chart surfaces both patterns before they become budget or governance surprises.
The Larridin angle
The multi-tool trend chart makes displacement events visible, the moments when one AI coding tool gains users at the same rate another loses them. These organic migrations are often invisible in static user count snapshots; they only appear when multiple tools' trajectories are plotted together over time. Larridin's Unified Analytics trends chart provides that multi-tool, longitudinal view as a standard feature, not a custom analysis.
Related Unified Analytics Metrics
Common questions
What does the AI Usage Trends chart show?
The AI Usage Trends chart displays AI user counts over time for each detected AI tool, illustrating the adoption trajectory of each tool in the environment.
Why are AI tool adoption trends important for the C-suite?
Adoption trends are crucial for portfolio decisions as they indicate whether a tool is gaining or losing users, helping to inform necessary interventions or strategic shifts.
How does Larridin's Unified Analytics help in understanding AI tool displacement events?
Larridin's multi-tool trend chart makes displacement events visible by showing when one AI tool gains users while another loses them, providing insights that static snapshots cannot.
What can cause a decline in AI tool user counts?
A decline in user counts may indicate the need for intervention such as a new enablement program, pricing changes, or governance decisions to redirect users to better alternatives.