
Enterprise AI Measurement Guide
Unified Analytics
AI Adoption
What percentage of our workforce is using AI tools across browser and desktop surfaces, and is that share growing, plateauing, or declining?
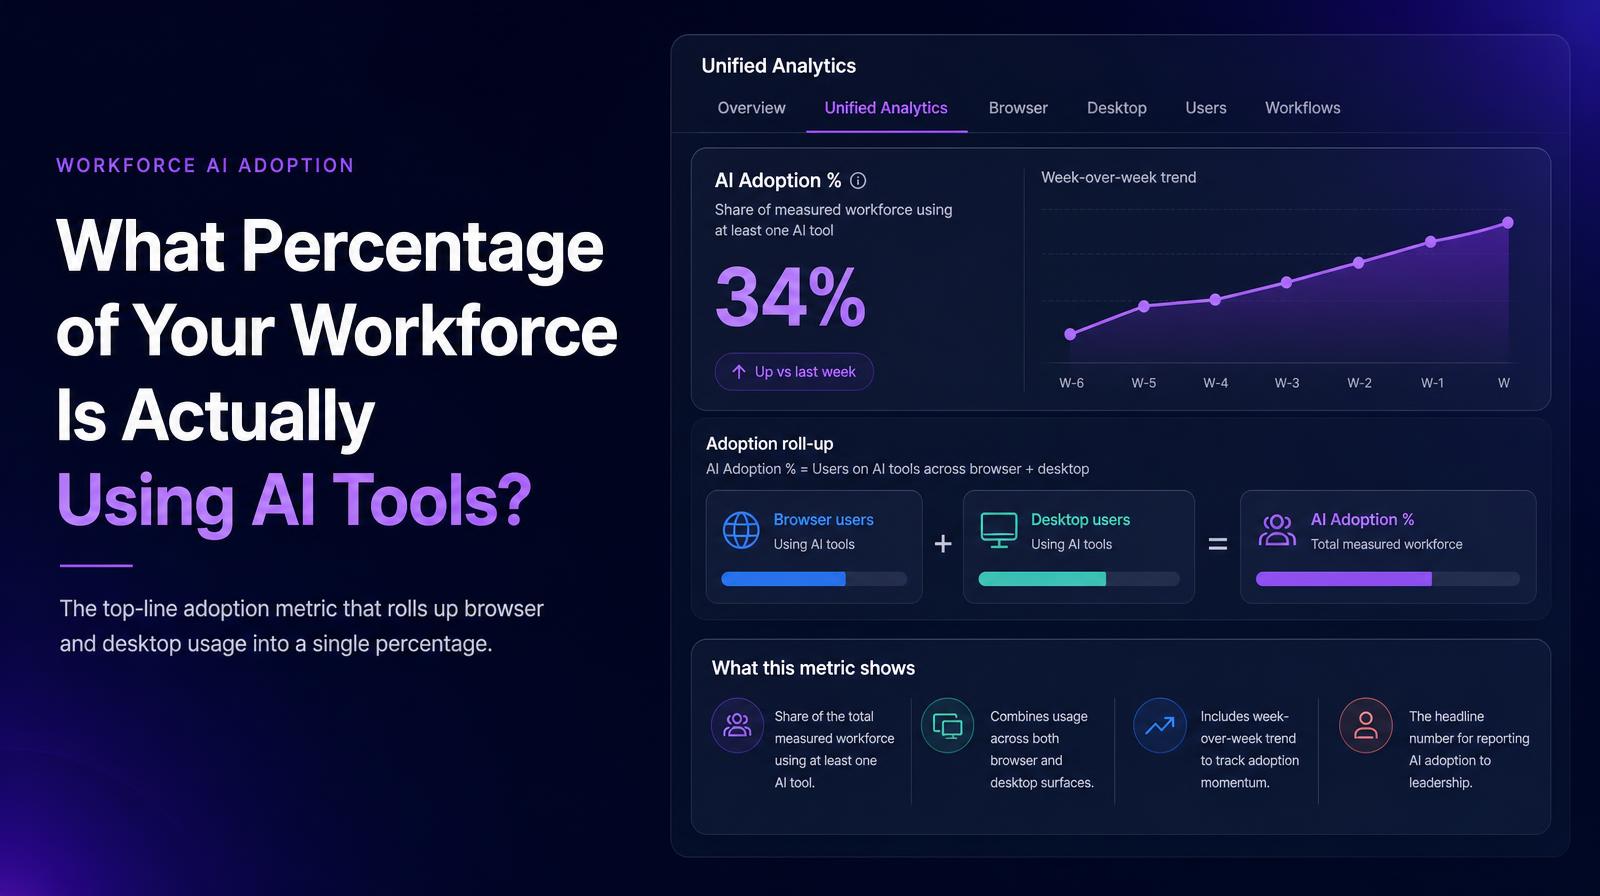
What it shows
The AI Adoption % in the Unified Analytics tab shows the share of the total measured workforce using at least one AI tool across both browser and desktop surfaces, with a week-over-week trend. As the top-line adoption metric, it rolls up browser and desktop usage into a single percentage, the headline number most organizations use when reporting AI adoption to leadership or the board.
Why it matters
AI Adoption % is the most commonly reported enterprise AI metric and the least sufficient on its own. An organization reporting 74% AI adoption has told leadership who has access to and has used a tool, it has not told them whether that usage is daily or occasional, shallow or deep, producing output value or running parallel to the work. The Unified Analytics AI Adoption % is the right entry point for any AI adoption conversation, but it requires the DAU, Active Events, and Tool Insights metrics in the same tab to become meaningful. Reading it in isolation creates the false confidence that underlies most enterprise AI ROI disappointments.
The Larridin angle
Larridin's Unified Analytics tab was launched in mid-March 2026 to eliminate the need to cross-reference browser and desktop data separately, a structural improvement that ensures the headline adoption figure reflects total tool usage rather than whichever channel happens to be measured first. The trend line makes adoption trajectory visible alongside the current rate, which is the signal that distinguishes a program accelerating toward meaningful coverage from one that plateaued six weeks ago.
Related Unified Analytics Metrics
Common questions
What does the AI Adoption % metric in Larridin Unified Analytics show?
The AI Adoption % metric shows the share of the total measured workforce using at least one AI tool across both browser and desktop surfaces, providing a week-over-week trend.
Why is the AI Adoption % important for the C-suite?
The AI Adoption % is crucial as it provides a top-line metric of AI tool usage, but it needs to be complemented with other metrics like DAU and Tool Insights for a complete understanding of AI's impact.
How does Larridin's Unified Analytics improve AI adoption reporting?
Larridin's Unified Analytics consolidates browser and desktop data into a single view, ensuring the adoption figure reflects total tool usage and provides a trend line for adoption trajectory.
What additional metrics are needed to fully understand AI adoption?
To fully understand AI adoption, metrics such as Daily Active Users (DAU), Active Events, and Tool Insights should be considered alongside the AI Adoption %.