
Enterprise AI Measurement Guide
Desktop Analytics
AI Usage Trends Chart
How have adoption rates for desktop AI tools changed over time, and which tools are gaining or losing adoption?
What it shows
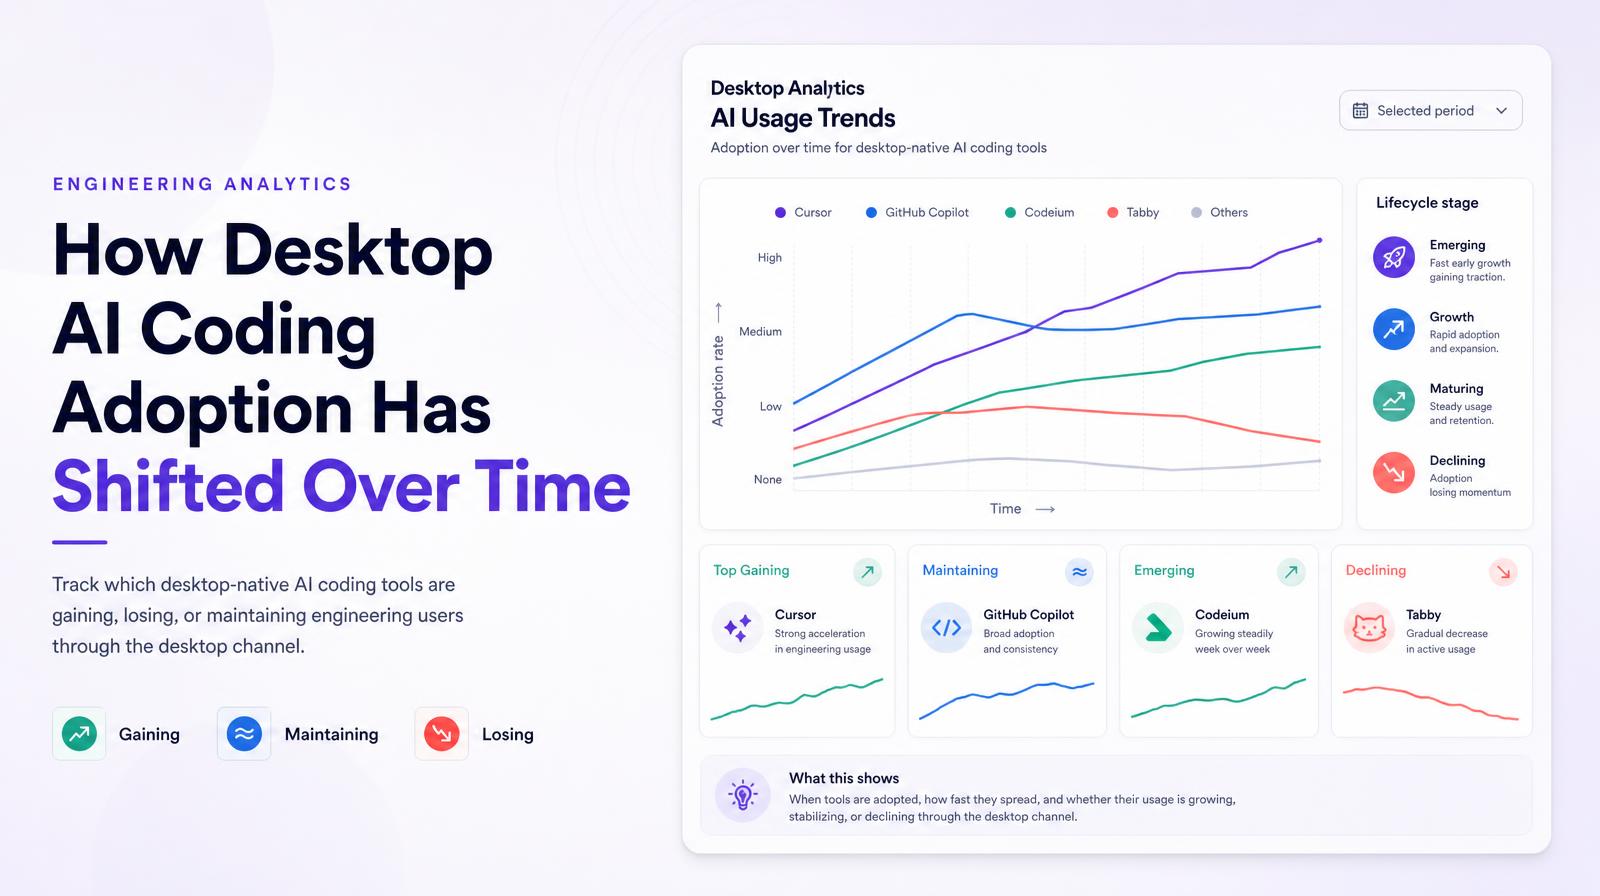
The Desktop Analytics AI Usage Trends chart plots adoption rates over time for each desktop-native AI tool detected in the environment, showing which tools are gaining, losing, or maintaining engineering users through the desktop channel over the selected period. This is the engineering tool adoption lifecycle chart: it shows when tools were adopted, how fast they spread, and whether they are sustaining or losing momentum.
Why it matters
Desktop tool adoption trends reflect the most consequential tool decisions engineering teams make, choosing which coding agent to use daily is a workflow-level commitment that takes weeks to form and weeks to change. Rising adoption curves for a specific desktop tool indicate genuine preference, not curiosity. Plateauing curves may reflect the tool having reached its natural ceiling in the engineering population, or a satisfaction issue that hasn't yet surfaced in surveys. Declining curves are the early warning signal that engineering leads are moving to alternatives, information that procurement and vendor relationships need before contracts renew.
The Larridin angle
The desktop trends chart is the tool that makes the "agentic AI era" adoption shift measurable. Organizations that introduced Claude Code or similar agentic tools in 2026 can see exactly when adoption began, how steeply it grew, and how it compares to earlier tool adoption curves, providing the before/after visibility for understanding how agentic AI changed the engineering tool landscape.
Related Desktop Analytics Metrics
Common questions
What does the Desktop Analytics AI Usage Trends chart show?
The chart displays adoption rates over time for each desktop-native AI tool, indicating which tools are gaining, losing, or maintaining users in the engineering environment.
Why are desktop AI tool adoption trends important for the C-suite?
These trends reflect critical tool decisions by engineering teams, indicating genuine preferences and potential issues, which are crucial for procurement and vendor relationship decisions.
How can the desktop trends chart help organizations understand AI adoption shifts?
The chart provides visibility into when adoption began, the growth rate, and comparisons to earlier tools, helping organizations understand the impact of agentic AI on engineering tools.
What might plateauing adoption curves indicate about a desktop AI tool?
Plateauing curves may suggest the tool has reached its natural user ceiling or there could be underlying satisfaction issues not yet identified in surveys.