


Key Takeaway
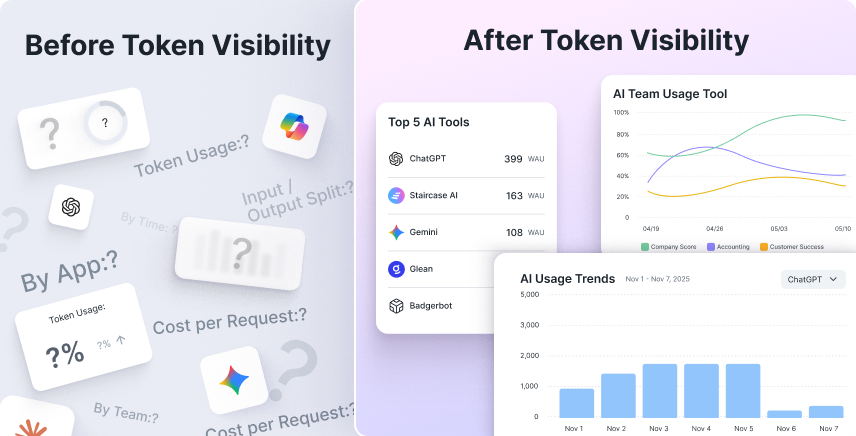
Without visibility into AI token consumption, finance leaders operate blind while costs accumulate.85% of enterprises miss their AI infrastructure forecasts by more than 10%, and 80% miss by more than 25%. Organizations that establish comprehensive AI usage analytics to track token consumption patterns, compare spending across teams and applications, and build usage-based forecasts transform unpredictable AI costs into manageable investments.
Quick Navigation
- The Token Visibility Crisis
- Understanding Token Economics
- Essential AI Usage Analytics
- Building Token Visibility
- Spend Attribution
- Multi-Agent Workflow Costs
- AI FinOps
- Tokens Per Feature
- Using Visibility for Cost Management
- Strategic Benefits Beyond Cost Control
- Frequently Asked Questions
Key Terms
- AI Token Consumption: The actual usage of computational units (tokens) when processing AI requests. Each token represents approximately three to four characters of text.
- AI Usage Analytics: Systematic tracking and analysis of how AI tools are consumed across an organization, measuring adoption patterns, frequency, and costs.
- Token Visibility: The ability to see, measure, and analyze token consumption patterns across users, teams, and applications.
- Token Usage Comparison: Analysis of token consumption patterns across dimensions like teams or time periods to identify efficiency opportunities.
The Token Visibility Crisis
Enterprise AI spending is racing toward $644 billion in 2025, up 76% from 2024, according to Gartner. Yet most organizations lack basic visibility into where this money goes.
Unlike traditional software with predictable seat-based pricing, AI operates on token consumption models where costs are based on actual usage. Every prompt and response consumes tokens and incurs charges. Without comprehensive AI usage analytics that track token consumption patterns, finance teams cannot answer fundamental questions: Which teams consume the most tokens? Which applications drive costs? When do spikes occur?
According to the Larridin State of Enterprise AI 2025, 81% of leaders say AI investments are difficult to quantify, while 79% report untracked AI budgets are becoming a growing accounting concern. This creates a dangerous cycle where CFOs approve budgets they cannot track, spending fragments across departments without visibility, and waste accumulates faster than value creation.
Understanding Token Economics
Tokens are the basic unit of text processing in AI models. A simple prompt like, "Summarize this document" might use 4 tokens, while the generated summary could be 200-300 tokens.
Pricing varies by provider, model, input and output usage, caching, and commercial terms. Use the applicable contract and current OpenAI or Anthropic pricing records, with effective dates, rather than treating a static list of rates as permanent. Token consumption and final billed cost are different measures.
Most organizations lack token visibility because employees use multiple AI tools across sanctioned and shadow applications. 84% of organizations discover more AI tools than expected during audits, and 83% report employees install AI tools faster than security teams can track. Token consumption happens at the interaction level, generating massive data volumes that traditional IT monitoring cannot capture.
Essential AI Usage Analytics
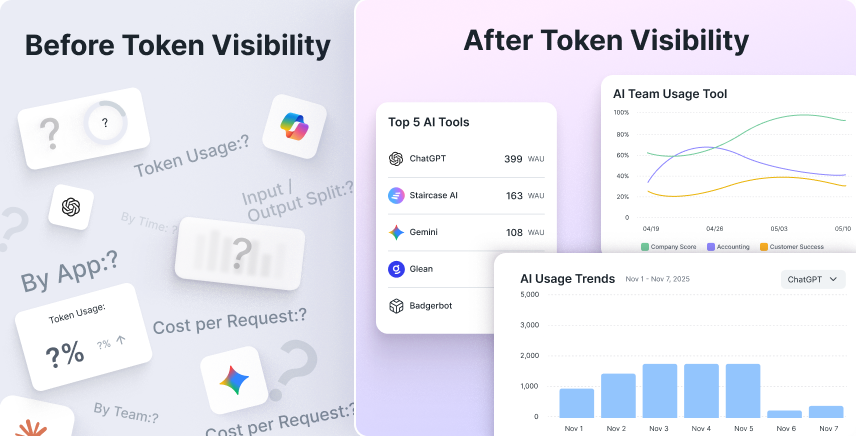
Comprehensive token visibility requires multi-dimensional AI usage analytics across several key areas:
Team-Level Tracking
Team-level analytics reveal who consumes tokens, at what volumes, and for which purposes. This enables finance to identify power users, spot unusual consumption patterns, allocate costs accurately, and benchmark normal usage ranges by role.Only 51% of organizations can track AI ROI effectively, according to CloudZero's State of AI Costs 2025. Team-level tracking closes this gap by connecting spending to specific work patterns.
Application-Level Measurement
Application-level analytics show which tools and workflows drive consumption. A simple chatbot might consume 500 tokens per interaction, while document analysis could consume 50,000 tokens. AI usage analytics reveal which tools deliver value proportional to cost, identify applications consuming excessive tokens, and expose redundancy where consolidation could reduce spending.
Temporal Patterns and Model Selection
Time-based analysis reveals when consumption spikes occur and why. Tracking which AI models organizations use for different tasks provides critical financial visibility, since premium models cost significantly more, but may not deliver proportionally better results for all use cases.
Comparative Analytics
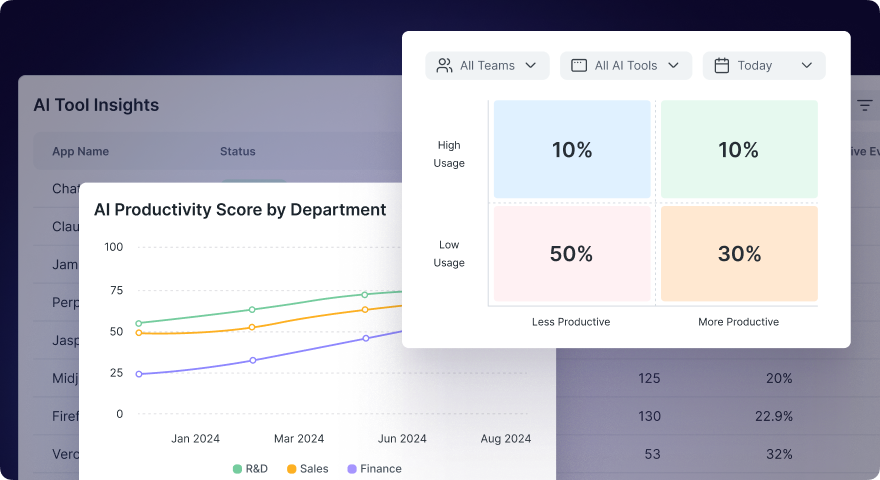
The real power of token visibility emerges from comparative analysis. How does Team A's consumption compare to Team B's for similar work? Which department uses AI most efficiently? According toMcKinsey's State of AI 2025, just 39% of organizations report EBIT impact at the enterprise level despite widespread use. Comparative analytics help finance leaders identify efficiency patterns and replicate them.
Building Token Visibility
Organizations can achieve basic token visibility within days through browser-based AND desktop monitoring that captures AI usage across web applications. Browser-based monitoring typically requires approximately one day for initial implementation. Desktop agents providing deeper visibility can be deployed within a few additional days.
Collect provider, gateway, cloud, or application usage records where they expose token and model data, and reconcile those records with invoices. Browser and desktop discovery can reveal tool activity, but application duration is not a direct token count. Where only proxies are available, label consumption as estimated, disclose the method and coverage, and validate it against available billing evidence.
Organizations implementing comprehensive AI measurement discover 3-5x more AI usage than initially expected, according to Larridin deployment data. This discovery phase is essential for accurate baseline establishment.
Add Attribution Behind the Total AI Bill
A consolidated total shows what the organization paid. The AI token spend attribution guide adds the explanation finance needs: which source, owner, workload, model, and outcome drove the charge.
- Source: Identify the provider, application, gateway, cloud service, or invoice.
- Owner: Assign the accountable department, team, or business leader.
- Workload: Connect consumption to an agent, project, workflow, or use case.
- Cost type: Separate subscriptions, token charges, infrastructure, and other relevant costs.
- Outcome: Record the accepted work or business result the expenditure supported.
Not every source supports every dimension. Preserve shared, estimated, and unattributed costs explicitly. A shared API key does not identify the team behind each request unless other reliable metadata supplies that connection.
Keep Observed Consumption and Billed Spend Separate
Credits, discounts, bundled allowances, caching, and provider pricing can make an invoice differ from the cost implied by token volume. Record both views and reconcile their differences. Align periods and currencies, and avoid counting a charge twice when provider telemetry and a cloud bill describe the same usage.
Spend concentration is a reason to investigate, not evidence of waste. A high-cost team may be doing valuable or unusually complex work. Compare scope, model mix, quality, and outcomes before deciding whether to cut, expand, or redesign its usage.
Follow Multi-Agent Costs From Request to Completed Work
The multi-agent token cost tracking guide explains why one business request can generate many model calls. Fan-out, retries, tool loops, and growing context make the cost of two otherwise similar runs differ.
Build attribution during execution rather than trying to reconstruct it from the monthly bill:
- Assign a workflow-run identifier: Carry it through orchestration, agent handoffs, and downstream model calls.
- Identify agents and steps: Preserve parent-child relationships and the team, project, or use case responsible for the work.
- Capture available call-level usage: Record provider, model, input, output, cached usage where relevant, and the pricing basis used to calculate cost.
- Label exceptions: Distinguish normal steps from retries, tool failures, validation failures, and timeouts.
- Define the accepted outcome: Separate technical completion from a result that meets business and quality criteria.
- Reconcile the rollup: Check that parent totals and child calls do not duplicate spending, and document telemetry gaps.
Track cost by agent or step, retry and recovery costs, cost per accepted workflow, and trends. Define whether the unit-cost numerator includes failed runs and recovery during the period; excluding them can understate the cost of producing successful work.
LLM observability tools such as Langfuse and Helicone can provide request or trace-level usage and cost evidence, subject to integration coverage. Finance may then need a broader allocation layer to connect that evidence to departments, budgets, and outcomes. A dashboard cannot recover identifiers that were never recorded, and external orchestration may expose only partial internal detail.
Use workflow-level alerts and appropriate execution controls alongside the program budget. Verify whether a mechanism warns, requires approval, limits retries, or stops execution. An alert does not itself impose a spending cap.
Make Token Visibility Part of the AI FinOps Operating Model
The AI FinOps guide organizes the work into visibility, allocation, forecasting, optimization, and value measurement. Token data becomes useful when it changes an accountable decision.
Assign an owner for the financial method, with engineering and business teams explaining workload changes. Track allocation coverage: the share of the defined spend total connected to an owner and use case. Disclose the scope and allocation rules, and investigate large unattributed pools instead of assigning them arbitrarily.
A CFO-ready review should include billed spending, observed consumption, allocation coverage, fixed commitments, actual and projected spend versus budget, material anomalies, and cost per useful outcome. Add the action taken and responsible owner.
Build forecast ranges from current commitments and observed workload drivers. Model changes in adoption, agent activity, pricing, credits, and model mix separately. Reforecast when those assumptions change rather than applying a single per-user average across concentrated or variable workloads.
Use attribution to target optimization: model routing, caching, retry reduction, license right-sizing, or workflow redesign. Test quality, reliability, latency, privacy, and risk before accepting a cheaper configuration. A lower token bill is not a saving if review and recovery costs rise elsewhere.
Connect Token Visibility to Engineering Units of Work
The tokens per feature guide adds an engineering planning input to the CFO view. Tokens per feature measures consumption relative to a consistently defined deliverable; AI cost per feature expresses the associated dollar cost. A PR, release, story, or another accepted unit may be more suitable in your environment.
Define the unit and measurement period first. Link relevant sessions and workflows to the delivered work, document shared costs, and record token volume alongside spending. Input, output, cached usage, model selection, and pricing terms mean that equal token counts need not have equal costs.
Compare similar work and use your own baseline rather than a universal benchmark. Complexity, context depth, agent usage, code durability, delivery time, quality, and rework all affect interpretation. A lower ratio does not prove greater productivity, and splitting one feature into smaller units can change the ratio without changing useful output.
Use a range from comparable completed work as one planning input, not a substitute for engineering judgment. Keep this metric as an extension of token visibility: consumption efficiency and financial efficiency are useful signals, but neither independently establishes ROI.
Using Visibility for Cost Management
Token consumption visibility creates the foundation for cost management through several strategic applications.
Identifying Cost Drivers
Comparative analytics reveal where spending concentrates and why. Finance teams can compare token consumption across teams performing similar work, analyze application-level spending to determine value proportional to cost, and examine temporal patterns to understand whether usage growth reflects business growth or inefficiency.
Benchmarking and Standards
Token visibility enables organizations to establish consumption benchmarks that define reasonable usage ranges. Finance can set standards for token consumption by role, create application-level benchmarks, and establish departmental budgets based on typical consumption.Average monthly AI spend reached $62,964 in 2024 and is projected to rise to $85,521 in 2025, a 36% increase according to CloudZero.
Anomaly Detection and Accountability
AI usage analytics enable automated anomaly detection. Finance teams can identify consumption spikes that exceed normal ranges, investigate specific applications or teams driving unexpected costs, and intervene before anomalies become sustained increases. Token visibility creates accountability by connecting spending to specific teams, enabling cost allocation frameworks, showback models, and eventually chargeback.
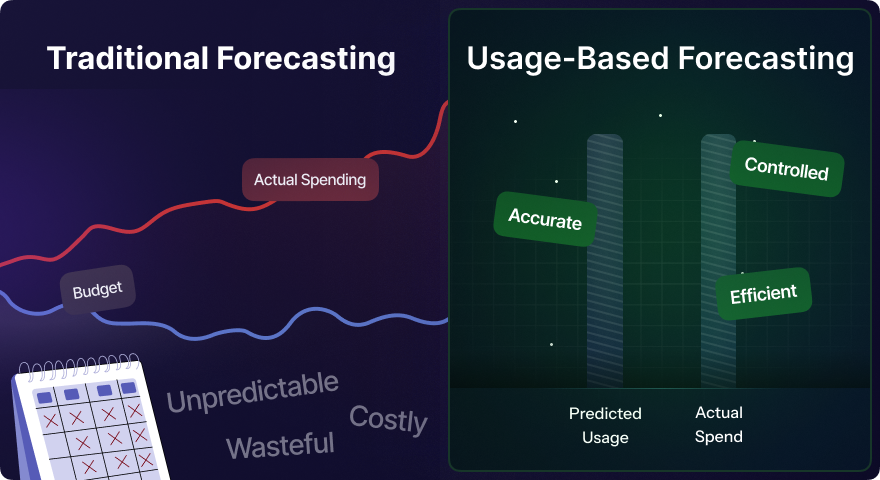
Usage-Based Forecasting
The most valuable application of token visibility is accurate forecasting. Finance teams can build forecasts by analyzing average tokens per role, measuring growth rates in adoption and consumption intensity, and identifying patterns that correlate with business metrics.85% of companies miss AI forecasts by more than 10%. Usage-based forecasting grounded in actual consumption data dramatically improves accuracy.
Strategic Benefits Beyond Cost Control
Token consumption visibility delivers value beyond immediate cost management.
- Informed Investment Decisions: Comprehensive visibility helps finance leaders invest in high-value AI tools, eliminate low-value applications, and negotiate effectively with actual usage data.
- Risk Management: Token visibility reveals shadow AI usage before it creates compliance problems and identifies data sharing patterns that might violate policies. 84% of leaders fear confidential data is being shared with public AI models, according to Larridin's research.
- Productivity Measurement: AI usage analytics reveal productivity patterns. Finance leaders can identify teams using AI most effectively, connect usage to business outcomes, and measure improvements attributable to AI adoption.
Frequently Asked Questions
How do organizations track token consumption across multiple AI tools?
Combine provider and gateway usage records, cloud billing, subscription and invoice data, and available tool-discovery telemetry. Preserve workflow and owner identifiers where possible. Label proxy estimates separately from measured tokens, and reconcile calculated costs with actual billed amounts.
How accurate do token estimates need to be?
Accuracy requirements depend on the decision and materiality. There is no universal acceptable error percentage. Document estimated versus observed data, test variance against invoices, and avoid using uncertain estimates for precise chargeback or unsupported comparisons.
What should CFOs do first to gain token visibility?
CFOs should immediately deploy AI usage analytics that capture application-level usage across the enterprise. Start with discovering which AI tools employees use and how frequently. Browser-based monitoring can be implemented in approximately one day, providing immediate visibility into web-based AI usage. Desktop agents can be added within days. The key is starting immediately rather than waiting for perfect solutions.
How do organizations balance visibility with employee privacy?
Effective AI usage analytics track usage at the application and aggregate level rather than monitoring individual prompt content. Organizations should capture which AI tools employees access and when, measure token consumption patterns, and track spending allocation across teams. Organizations should not capture the specific content of employee prompts or responses, personal communications, or detailed screen monitoring. This provides comprehensive financial visibility while respecting privacy.
What is allocation coverage?
It is the share of the defined AI spend total connected to an owner and use case. Track the scope, allocation method, and remaining unknown costs so improving the ratio does not create false precision.
Why track costs by workflow rather than model alone?
A workflow may call several models and agents, retry failed steps, and use shared infrastructure. Model totals identify a cost source but may not explain the business process that generated it. Workflow identifiers connect the calls to the work and its owner.
Does lower tokens per feature prove better AI ROI?
No. It measures consumption relative to a defined engineering unit. Assess the associated dollar cost, complexity, quality, rework, delivery time, and value. Compare consistently defined work and avoid turning the ratio into an individual leaderboard.
About Larridin
Larridin is the AI Measurement Company. We measure AI utilization, proficiency, and business value across your enterprise through our Larridin AI usage analytics platform.
Finance leaders use Larridin to discover their complete AI landscape including shadow AI usage, establish comprehensive token consumption visibility across teams and applications, compare usage patterns to identify efficiency opportunities, and build accurate forecasts based on real consumption data.