


TL;DR
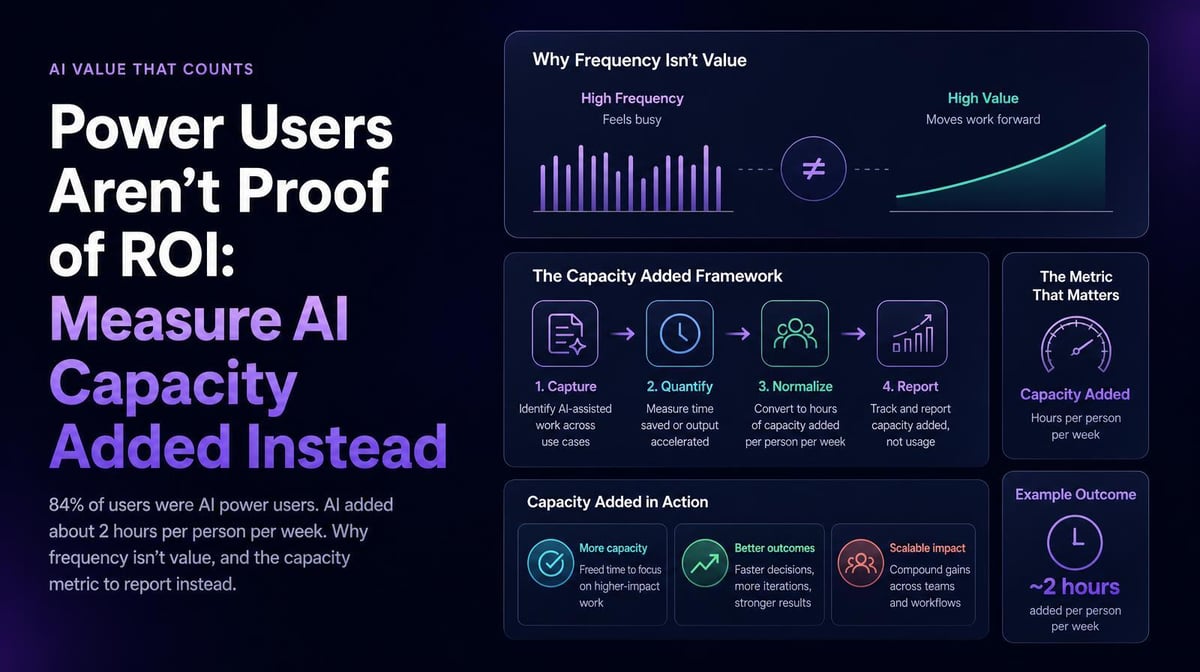
Short answer: A high share of power users tells you how often people open AI, not how much work AI takes off their plate. Track AI capacity added: estimated hours of manual work AI absorbs per person per week. In one customer’s instance, 84% were power users, and AI added about two hours of capacity per person per week over four weeks.
Key wins:
- Pair frequency metrics with an hours-per-person number a CFO can price.
- Find use case gaps that could limit capacity growth.
- Set a baseline you can trend every week.
Who it’s for: CFOs, CAIOs, and COOs reviewing AI ROI.
What’s a Spark Insight? Sparks are short, data-backed findings Larridin surfaces from how AI is actually used across an organization. This post expands on one of them.
Quick Answers
If you’re asking… | The answer |
|---|---|
Do power users prove AI ROI? | No. Power-user tiers measure frequency. ROI depends on what that usage produces and what it costs. |
What should I measure instead? | AI capacity added: hours of manual work AI absorbed, divided by people and weeks. It turns usage into a number finance can price. |
What’s a realistic number? | In one customer’s instance, about 2.0 hours per person per week, a 5.1% lift on a 40-hour week, with 84% of users in the Power User tier. |
Why is capacity flat when usage is high? | In this instance, research and writing accounted for 42% of AI activity. Expanding into other use cases may help increase capacity added. |
What We Hear From Leaders
- Most of our people are power users, so AI is clearly paying off.
- Adoption is above 90%. What else is there to measure?
Both statements describe activity. Neither says what the activity is worth.
What you struggle with | What you need | How Larridin helps |
|---|---|---|
Dashboards celebrate power-user counts | A value metric beside the usage metric | AI Capacity Added shows hours of manual work AI took on, week by week |
No way to price AI for the CFO | Hours per person per week | Capacity converts to hours and FTE equivalents you can cost out |
Capacity stays flat as usage climbs | To see which use cases carry the load | The use case breakdown shows where activity concentrates |
The Data: 84% Power Users, 2 Hours a Week
In one customer’s instance, the numbers looked like a rollout success:
- 96.3% of users were active.
- In the week of Oct 5, 21 of 25 users (84%) sat in the Power User tier, with zero Light Users.
- AI Capacity Added came to 267.7 hours across four weeks for 33 people.
That works out to about 2.0 hours per person per week, a 5.1% lift on a 40-hour week. Weekly hours added stayed in a narrow band the whole time: 68.9, 60.9, 61.7, and 76.3.
The use case mix suggests where to look next. Knowledge & Research and Writing & Communication were each 21% of activity, 42% together. Technical Tasks and Coding were 7%, and “Other” was 13%.
Sample note: this instance covers 25–33 users over four weeks. Treat it as a pattern to test in your own data, not a benchmark.
Why Don’t Power Users Translate Into ROI?
Power-user tiers reflect how frequently people use AI, not the value of each interaction. Someone who asks AI to polish ten emails a day looks like a power user and may save 20 minutes.
Google’s 2025 DORA report found that 90% of surveyed technology professionals use AI at work. A separate Google analysis reported that AI users spent a median of about two hours interacting with AI on their most recent workday. Time spent with AI is not time AI saves. The distinction matters when calculating ROI.
What Actually Moves AI Capacity Added?
Breadth is one lever to test. Capacity can grow when AI takes on new kinds of work, not just when people repeat the same task more often. Larridin measures use case breadth through Use Case Diversity as part of Proficiency Insights. Teams can use it to identify opportunities beyond drafting and summarizing.
Three levers matter most:
- Move up the task ladder. Shift from drafting to multi-step work like data analysis, report assembly, or workflow automation.
- Open the “Other” bucket. Unclassified activity may contain experiments worth formalizing or noise worth cutting.
- Enable by role. Give each team two or three high-value use cases tied to its real work, then watch whether capacity moves.
How to Measure AI Capacity Added
- Baseline it. Record weekly hours added and active people for four weeks before any enablement push.
- Normalize it. Report hours per person per week alongside totals, so team size doesn’t distort comparisons.
- Pair it with tiers. Put power-user share and capacity side by side. If usage rises but capacity stays flat, investigate what's driving the gap.
- Break it down by use case. Track the share of activity in research and writing versus analysis, automation, and coding.
- Price it. Multiply estimated hours by loaded hourly cost to calculate potential capacity value, then compare it with AI spend. Don't confuse potential capacity value with realized savings.
FAQ
What is AI capacity added?
The estimated hours of manual work AI took on over a period. Divided by people and weeks, it shows how much capacity AI adds to each person.
Is 2 hours a week per person good?
Two hours per person per week can be meaningful. The useful question is whether the number rises as enablement widens use cases. Flat capacity during heavy usage is a reason to examine use case breadth.
Should we stop tracking power users?
No. Keep it as an engagement signal, but never report it alone as evidence of ROI.
Spark a discussion that moves your AI strategy forward. [Get your first Sparks
Sources
- Announcing the 2025 DORA Report, Google Cloud
- How Are Developers Using AI? Inside Our 2025 DORA Report, Google, September 23, 2025