


High AI adoption feels like progress, but it says little about whether AI is changing how work gets done. Spark data shows the gap between “people use AI” and “AI is part of the work,” and the metrics that close it.
TL;DR
The Short Answer
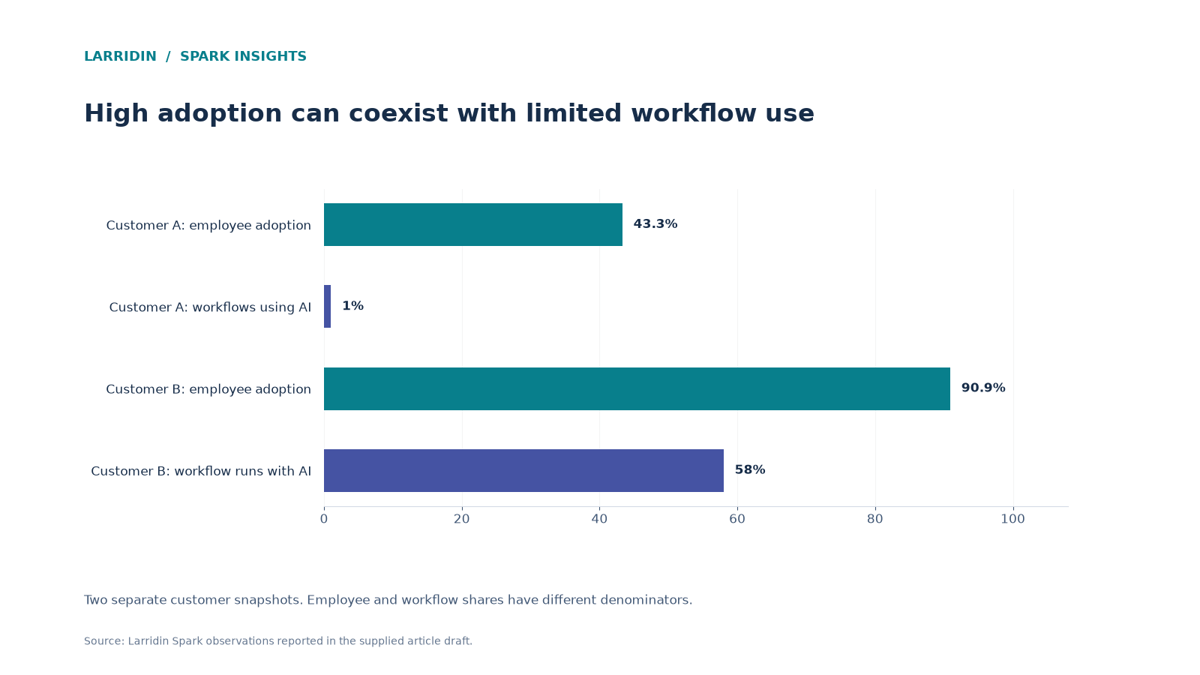
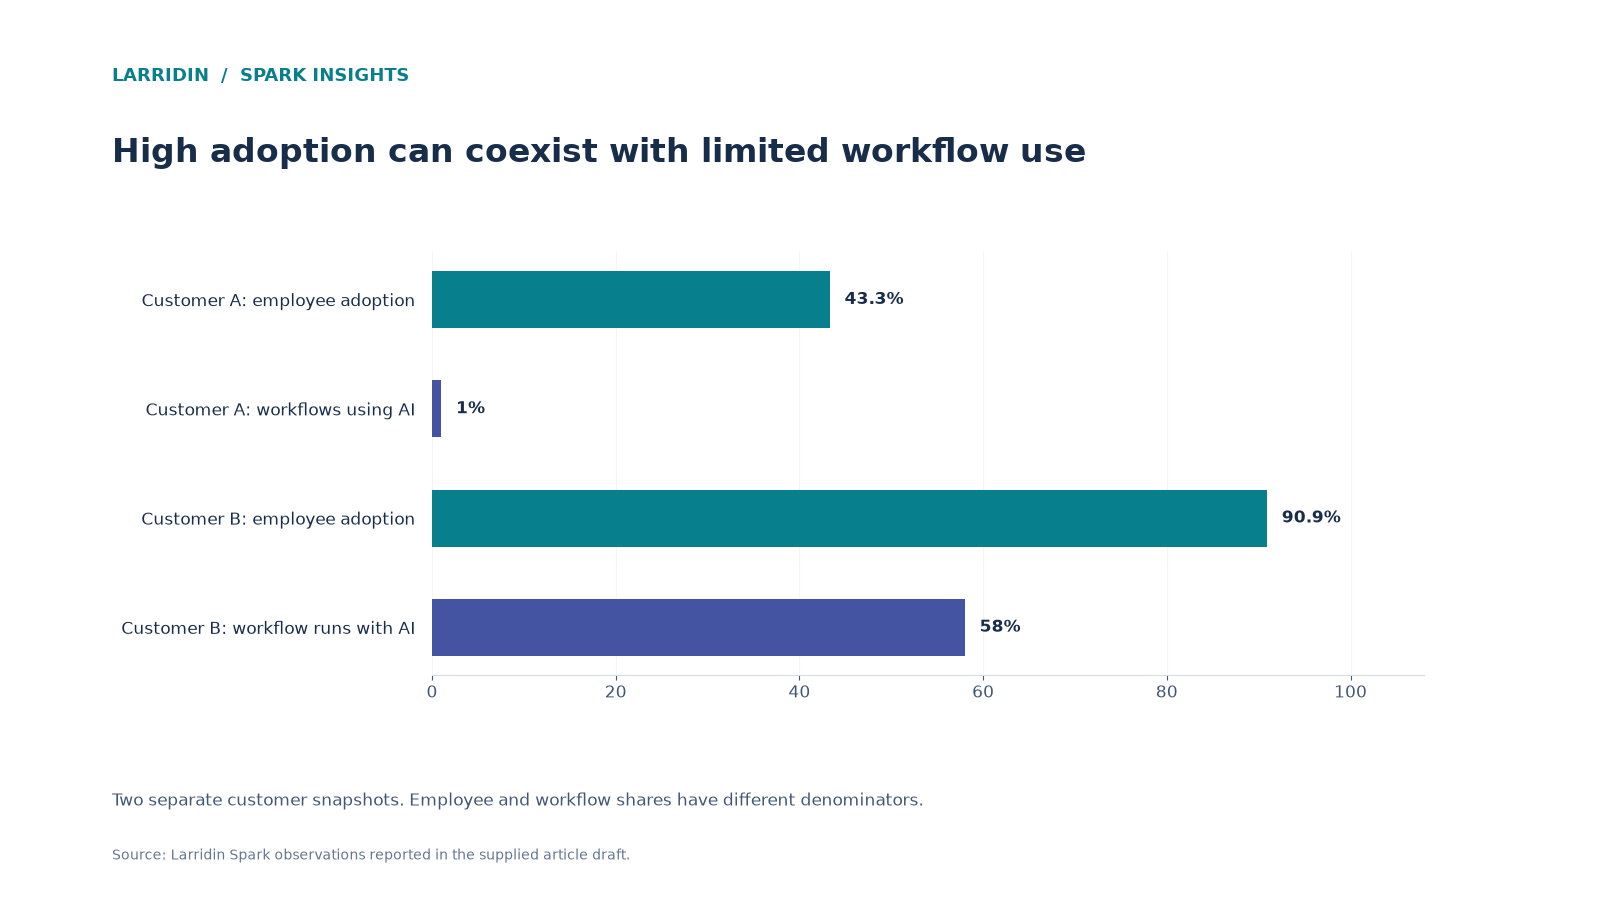
At one Larridin customer, 43.3% of employees had adopted AI, but just 1% of workflows used it. Track AI in workflows, use case breadth, proficiency, and engagement depth alongside adoption to see how people are using AI and where to investigate results.
Key Wins
- See why a 90% adoption rate can sit alongside flat or falling AI use in real workflows
- Track five metrics that show how deeply AI is being used, not just who uses it
- Give leadership a scorecard that goes beyond adoption alone
What’s a Spark Insight?
A Spark Insight is a data-backed finding Larridin surfaces automatically from how your teams actually use AI, flagging the patterns worth a leadership conversation.
Who This Matters To
CIO · CAIO · CHRO
Quick Answers
| If you’re asking… | The answer | Go deeper |
|---|---|---|
| Is AI adoption rate a good measure of AI success? | Not on its own. It counts who has used AI, not how. In one org, 90.9% adoption coexisted with AI in workflow runs falling 11% to 58%. | The data |
| What should I track instead of AI adoption? | AI in workflows, use case diversity, proficiency, and engagement depth. Together they show whether AI is becoming part of how work gets done. | What to track |
| Does high AI adoption prove ROI? | No. Adoption measures usage, not financial return. Look at workflow involvement and business outcomes separately. | Why the gap exists |
| What are employees using AI for? | In one customer, Writing and Communication accounted for 22% of AI activity, compared with 8% for Creative and Ideation. | The data |
A high adoption rate is encouraging. The harder question comes next: what is all that usage producing? Adoption answers “are people using AI?” Leaders also need to know whether it’s becoming part of how work gets done.
What You’re Struggling With, and How to Fix It
| What you’re struggling with | What you actually need | How Larridin helps | Proof from Spark data |
|---|---|---|---|
| “Our adoption numbers look great, but I can’t show what we’re getting for it.” | Metrics that connect AI use to how work gets done | Measures AI in workflows, not just logins, so you can see where AI is part of the process | One org: 43.3% adoption, 1% of workflows using AI |
| “Usage is high, but it feels shallow.” | A view of what people actually use AI for | Breaks AI activity into use case categories across teams | One org: 89.8% adoption; writing & comms 22% of use, creative/ideation 8% |
| “Adoption kept rising while impact seemed to stall.” | A trend line that shows when AI drops out of workflows | Tracks workflow runs with and without AI over time | One org: 90.9% adoption while AI in workflow runs fell 11% to 58% |
| “Seat counts don’t tell me which tool is working.” | Engagement depth per tool, not just users per tool | Compares recorded active events per user across tools | Larridin’s own data: one tool had lower adoption but over 10x the events per user |
What This Means for You
If you’re a CIO
The question you’re asked: “We hit our adoption target. What’s the return?”
What to do: Report AI in workflows and engagement depth alongside adoption. Investigate teams where adoption is high but workflow use is low before deciding what support they need.
For more on enterprise-wide AI measurement, see AI Monitoring for CIOs.
If you lead AI strategy
The question you’re asked: “Which AI programs are actually working?”
What to do: Set a five-metric scorecard (adoption, AI in workflows, use case diversity, proficiency, and engagement depth) and review it monthly by team, not just org-wide.
For more on measuring and optimizing AI programs, see AI Monitoring for CAIOs.
If you’re a CHRO
The question you’re asked: “Are our people getting better at using AI?”
What to do: Shift training goals from “everyone has access” to “more people use AI across more kinds of work.” Track use case breadth as the outcome.
For more on workforce AI readiness, see AI Monitoring for CHROs.
What the Sparks Data Shows
- 43.3% vs. 1%: AI adoption vs. share of workflows using AI in a life sciences organization.
- 90.9% adoption, AI workflow runs down 11%: Adoption stayed above 90% while workflow runs with AI fell to 58%. 42% of workflow runs had no AI involvement, with an estimated 18 days of potential savings.
- Engagement depth vs. adoption: In Larridin’s own internal data, one AI tool had higher adoption (39.5% of users) but averaged 28 events per user. Another had lower adoption (30.2%) but averaged 298 events per user. The tool with fewer users showed much higher recorded activity per user.
Why Isn’t AI Adoption a Good Success Metric?
Because it measures who uses AI, not whether it's becoming part of how work gets done.
An adoption rate measures how many people use AI, not what they do with it. It doesn’t distinguish between an employee who asks AI to polish an email each week and a team that has rebuilt a process around it. That’s why adoption can climb while impact stays flat.
Unframe's AI ROI: 2026 Benchmarks describes a similar gap: value created at the task level doesn't always translate into measurable business outcomes. Larridin Spark data makes the usage side of that gap visible inside individual organizations.
Spark callout: In one life sciences organization, 43.3% of employees had adopted AI, but just 1% of workflows used it. Adoption was real. Workflow change was almost nonexistent.
Myth: High adoption means AI is delivering value.
Reality: In one org, adoption held above 90% while AI in workflow runs fell 11%.
What Should You Track Instead of Adoption?
Four metrics: AI in workflows, use case diversity, proficiency, and engagement depth.
AI in workflows measures the percentage of tracked workflow runs involving AI. Use case diversity shows whether people apply AI beyond the obvious, like writing and summarizing. Proficiency measures how skillfully people use it. Engagement depth, such as events per active user, shows how much recorded activity follows adoption.
None of these replaces adoption. Adoption tells you the door is open. These tell you what’s happening once people walk through it.
How to Move Beyond Adoption in Your Own Org
- Baseline adoption by team. Keep it, but stop reporting it alone.
- Measure AI in workflows. Track the percentage of workflow runs involving AI.
- Map use cases. See how much activity is writing and summarizing vs. analysis, ideation, and automation.
- Track engagement depth and proficiency monthly. Use Larridin's AI Adoption, AI Fluency, and workflow measurements to see where usage is becoming more consistent and reaching day-to-day work.
Frequently Asked Questions
What is a good AI adoption rate?
There's no universal target. Even a high adoption rate tells you little about outcomes on its own. Once employees are using AI, the next question is how deeply they're using it and whether it's showing up in their workflows.
What is “AI in workflows”?
It's the percentage of tracked workflow runs that involve AI. It shows whether AI appears during recurring work, rather than only in separate, occasional tool use.
What is use case diversity?
Use case diversity measures how many different kinds of work people apply AI to. A team that uses AI only for writing has low diversity, even if every person uses it daily.
How do I report AI value to the board?
Pair adoption with at least one workflow metric and one outcome metric, and show the trend by team. That tells the board where AI is changing work, not just where it’s licensed.
Spark a Discussion That Moves Your AI Strategy Past Adoption
See how often AI shows up in your organization's workflows, team by team, and bring the findings to your next leadership meeting.