PRs Merged ≠ Productivity
When AI generates 80% of a PR, counting PRs tells you nothing about real engineering output.

Developer Productivity
Traditional dev productivity metrics break when AI enters the workflow. Scout gives engineering leaders the framework, data, and AI analyst to answer the questions that matter.
When AI generates 80% of a PR, counting PRs tells you nothing about real engineering output.
AI produces 10x more lines. But are they features, or boilerplate that gets reverted in 30 days?
Code ships faster through CI, but review queues are 2.3x longer. The bottleneck just moved.
You need metrics designed for how software is actually built today.
No single metric tells the truth. These pillars work together as guardrails and check metrics.
Are teams using AI tools?
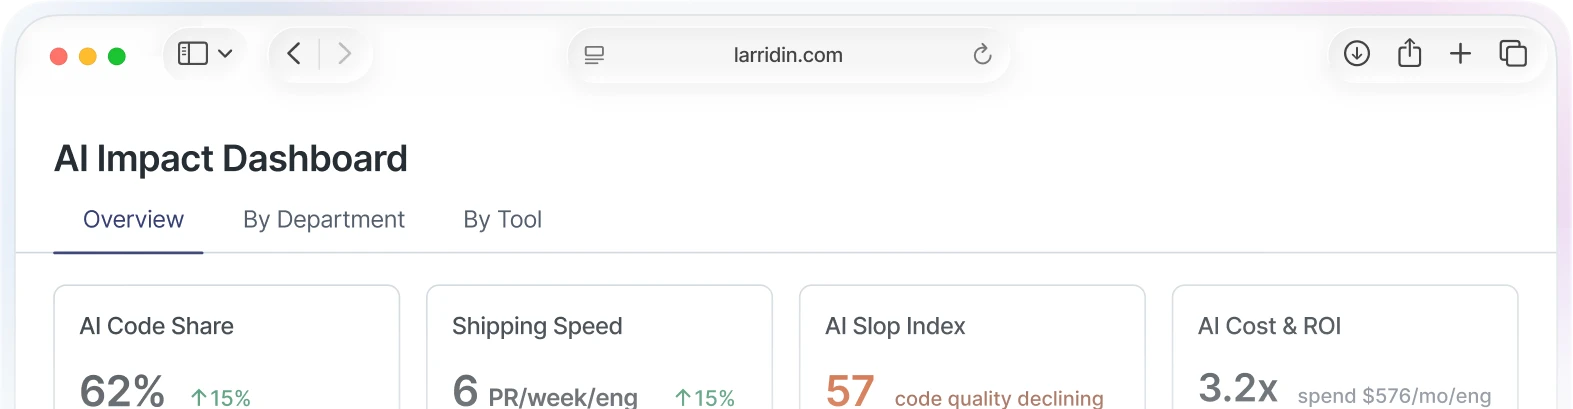
66% WAU
What % of code is AI-generated?
58%
Complexity-adjusted throughput
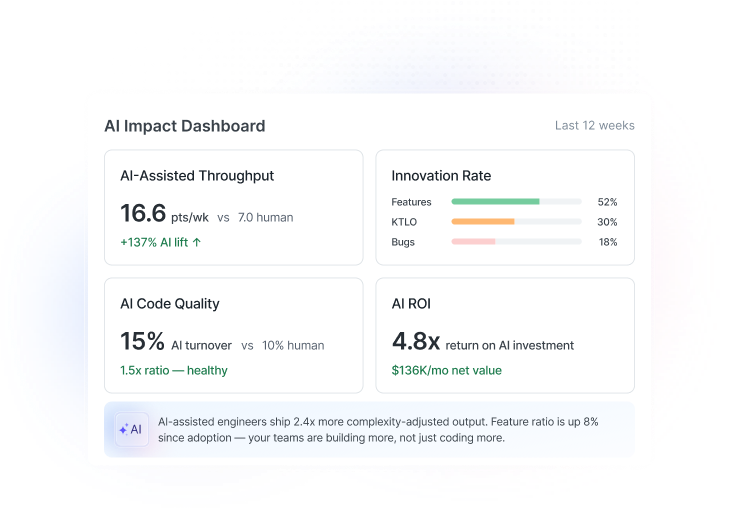
16.6 pts
Is AI code durable or disposable?
15% turnover
Is the investment paying off?
4.8x ROI

Are your engineers building new features — or drowning in bug fixes and infrastructure? Track what your team actually ships, not just how much.
Don’t just look at dashboards. Ask Scout AI to investigate hypotheses, correlate metrics, and surface what’s really happening.


Telemetry shows what. Surveys reveal why. Benchmarked surveys capture time savings, barriers, AI fluency, and satisfaction.
Justify AI investment to the board with hard ROI numbers, not anecdotes.
Learn MoreKnow which teams thrive with AI and which need support — before they tell you.
Learn MoreSee your own productivity patterns. Find which tools work best for your stack.
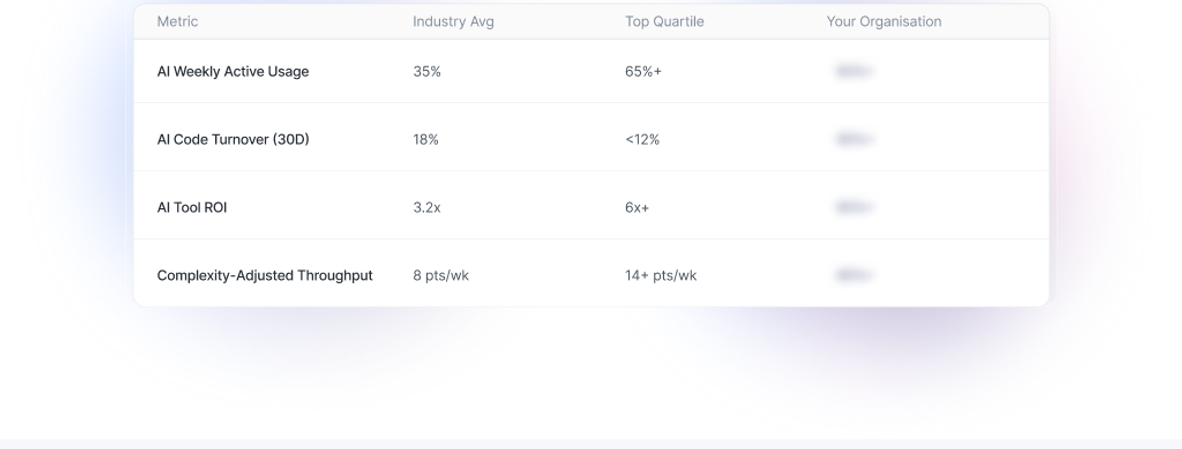
Learn MoreIndustry benchmarks for the AI era. Book a demo to see how your org compares.
Trusted by AI-forward enterprises






Start with a discovery call. We’ll show you how Larridin gives you complete visibility into your AI transformation in minutes, not months.