Is Our AI Investment Paying Off?
ROI quantification across tools and teams. See exactly which tools deliver value, which teams benefit most, and where spend can be optimized.

For VP Engineering & CTO’s
Your company spends $50K+/month on AI coding tools. Scout quantifies the return — velocity gains, quality impact, and dollar ROI — so you can make data-driven investment decisions.
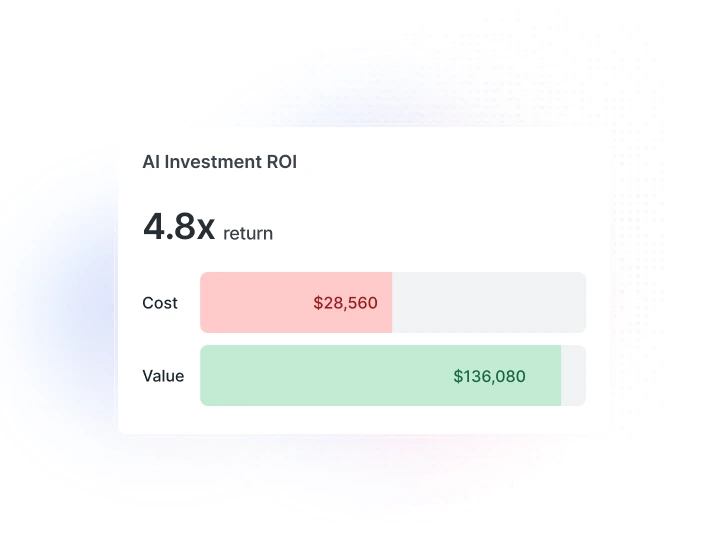
Scout answers the hard questions your board and CFO will ask about your AI investment.
ROI quantification across tools and teams. See exactly which tools deliver value, which teams benefit most, and where spend can be optimized.
Code turnover monitoring with red-flag thresholds. Track whether AI-generated code sticks or gets rewritten within days, weeks, or sprints.
Benchmarks from 500+ engineering teams. Know whether your AI adoption, velocity gains, and quality metrics are above or below industry norms.
Scout’s AI analyst correlates adoption, velocity, quality, and cost data to answer strategic questions in seconds — not hours of spreadsheet analysis.
Copilot acceptance rate up 18% over 90 days. Claude Code sessions up 3.2x since rollout.
Adoption: StrongCycle time down 22%. PR throughput up 31%. Coding time reduced but review time increased 15%.
Velocity: Net positive, constraint shiftedCode turnover rate stable at 8.2%. Bug-fix ratio unchanged. No regression in code quality metrics.
Quality: No degradationStart with a discovery call. We’ll show you how Larridin gives you complete visibility into your AI transformation in minutes, not months.