Team-level Drill-downs
Compare adoption, velocity, quality, and cost per team with 2-level deep breakdowns. See which teams are thriving and which need support.

For Engineering Managers
Some teams ship 2x more with AI. Others burn licenses. Scout shows you which is which — and what high-performing teams do differently.
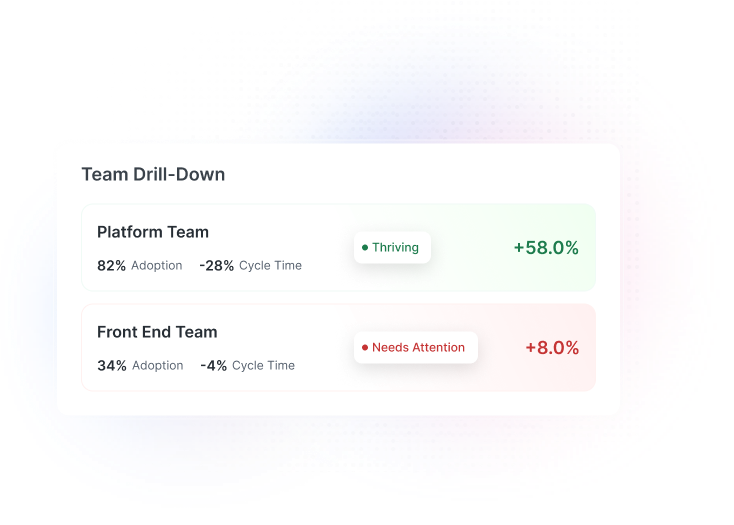
Deep visibility into how AI is working across your teams without micromanaging.
Compare adoption, velocity, quality, and cost per team with 2-level deep breakdowns. See which teams are thriving and which need support.
See where delays shifted post-AI. Coding time may be down, but has the bottleneck moved to review or testing? Scout surfaces the shift.
AI-attributed ticket data shows which work types benefit most from AI assistance. Focus AI investment on high-impact areas.
Ask a question, get an investigation. Scout walks you through the data to find answers, not just charts.
Platform team: 82% active AI users, avg 4.2 sessions/day. Mobile team: 34% active users, avg 0.8 sessions/day.
Gap: 2.4x adoption differencePlatform: cycle time down 28%, PR throughput up 45%. Mobile: cycle time down 4%, PR throughput flat. Strong adoption-velocity correlation.
High adopters: 5.8x more velocity gainsMobile team survey: "AI tools don't support Swift well" (72%), "No time for setup" (58%). Platform team had structured onboarding.
Barrier: Tooling fit + onboarding gapStart with a discovery call. We’ll show you how Larridin gives you complete visibility into your AI transformation in minutes, not months.