
DORA metrics
The 5-Pillar Framework for
AI-Native Developer Productivity
Traditional frameworks like DORA and SPACE weren’t designed for a world where AI writes most of the code. This framework was.
Why Traditional Frameworks Fail
Frameworks built for a pre-AI world produce misleading signals when AI generates most of the code.
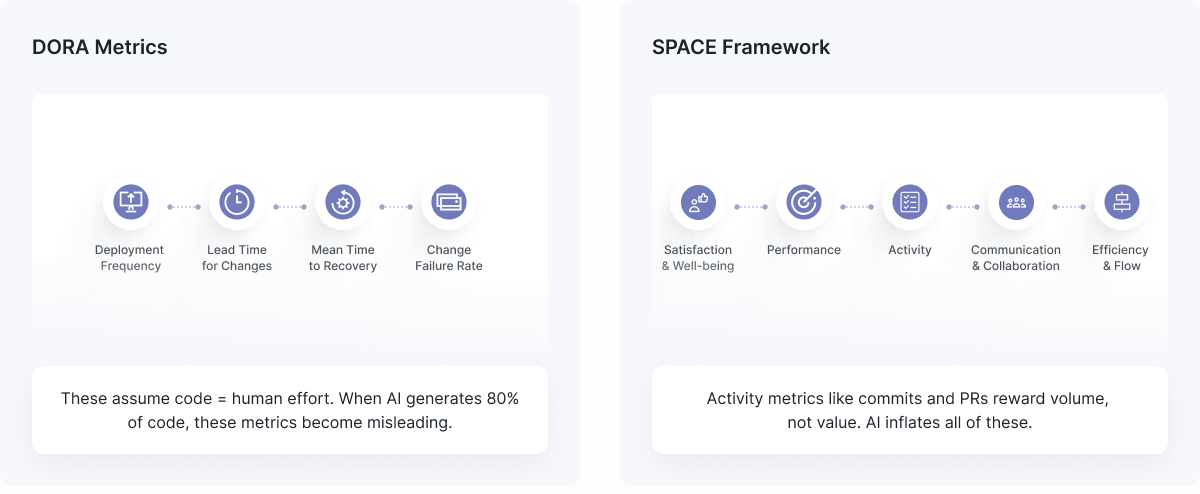
SPACE framework
Broad signal set, but not computable enough for AI-native work.
Needs extra telemetry to separate adoption, output, quality, and ROI.You need metrics designed for how software is actually built in 2026.
The AI Impact Hierarchy
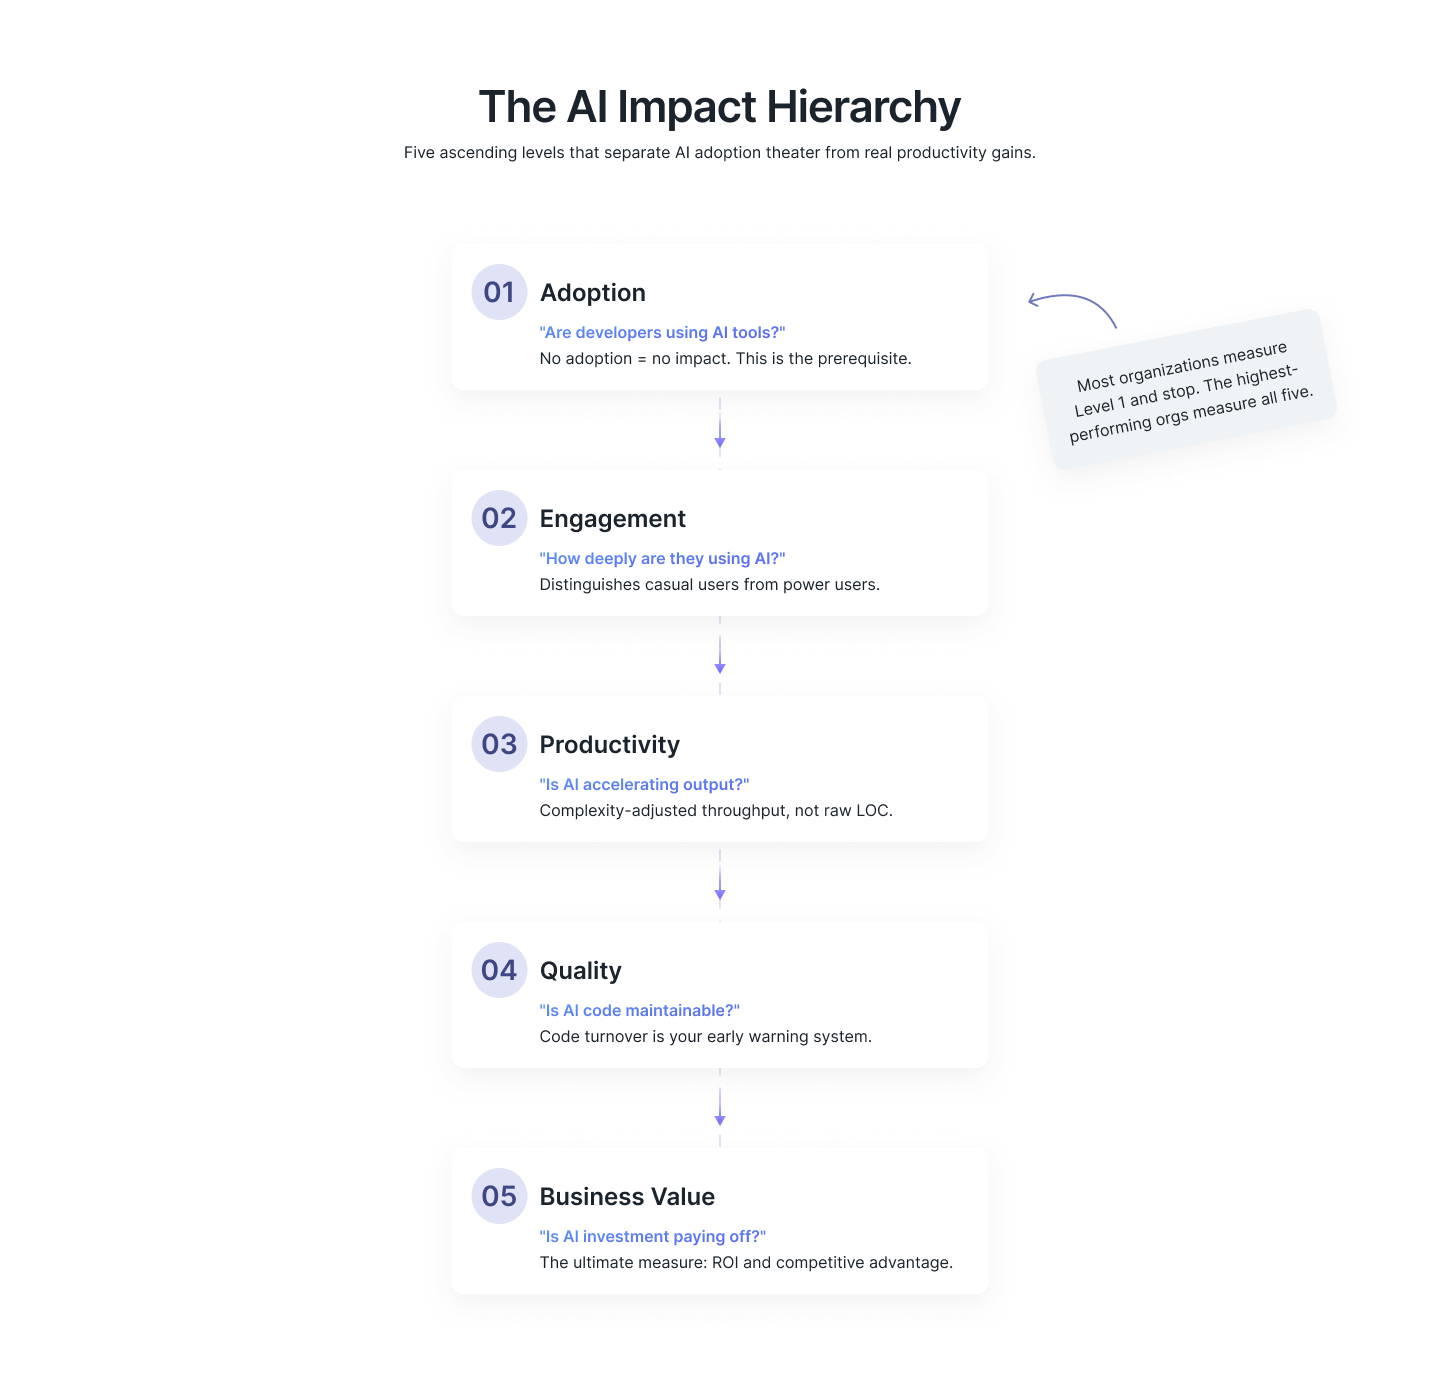
Adoption
Are engineers actively using AI tools?
Code Share
How much committed code is AI-assisted?
Velocity
Is complexity-adjusted throughput improving?
Quality
Is AI-generated work durable or disposable?
Business Value
Does the investment produce measurable ROI?
Deep Dive: The 5 Pillars
Each pillar targets a distinct layer of AI productivity measurement.
What it measures
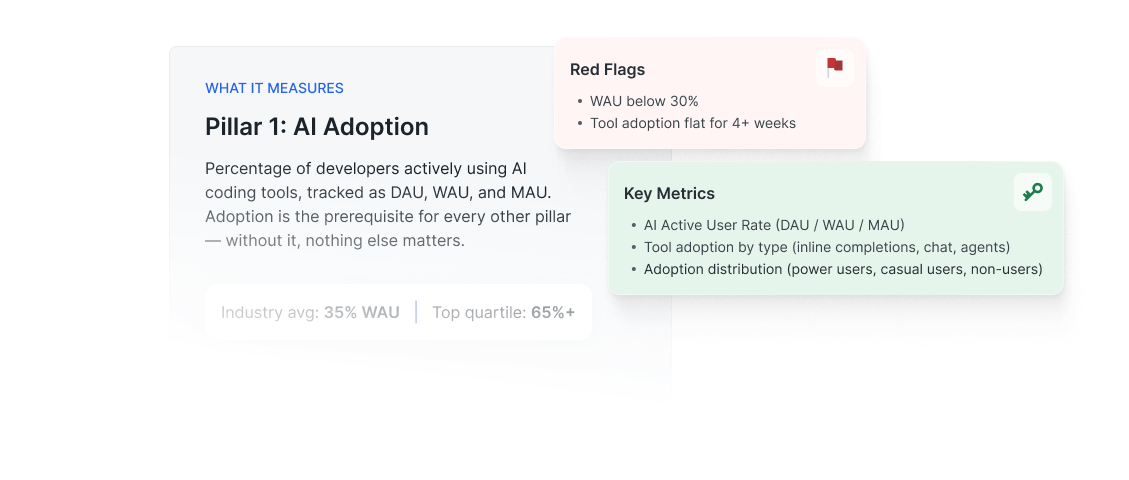
Pillar 1: AI Adoption
Percentage of developers actively using AI coding tools, tracked as DAU, WAU, and MAU. Adoption is the prerequisite for every other pillar — without it, nothing else matters.
Industry avg: 35% WAU
Top quartile: 65%+
Red flags
- WAU below 30%
- Tool adoption flat for 4+ weeks
Key metrics
- AI Active User Rate (DAU / WAU / MAU)
- Tool adoption by type (inline completions, chat, agents)
- Adoption distribution (power users, casual users, non-users)
What it measures
Pillar 2: AI Code Share
Percentage of committed code that was generated or assisted by AI. This is the bridge between adoption and actual engineering output — answering whether AI is doing real work or sitting idle.
Industry avg: 25%
Top quartile: 50%+
Red flags
- High AI code % with no quality metrics = blind spot
Key metrics
- AI-Assisted PRs %
- AI-Assisted Lines %
- AI-Assisted Commits %
What it measures
Pillar 3: Velocity (Complexity-Adjusted Throughput)
Engineering output weighted by complexity, segmented by AI vs human contribution. Raw PR counts and LOC are meaningless when AI can generate thousands of lines in seconds — CAT cuts through the noise.
Industry avg: 8 pts/wk/eng
Top quartile: 14+ pts/wk/eng
Red flags
- CAT flat while raw PRs increase = AI inflating volume without real output
Key metrics
- CAT per engineer (Easy = 1 pt, Medium = 3 pts, Hard = 8 pts)
- Delivery volume (AI-assisted vs human-only)
- Cycle time (commit to deploy)
What it measures
Pillar 4: Quality
Durability of AI-generated code. If AI-written code churns at twice the rate of human-written code, your velocity gains are illusory. Quality is the check on speed.
Industry avg: 18% 30D turnover
Top quartile: < 12%
Red flags
- AI turnover > 2x human turnover
- Core logic AI turnover > 25%
Key metrics
- Code Turnover Rate (30-day and 90-day, AI vs Human)
- Innovation Rate (Features vs KTLO vs Bugs)
What it measures
Pillar 5: Cost & ROI
Financial return on AI tool investment. Engineering leaders need to justify seat costs to the CFO — this pillar translates productivity gains into dollars.
Industry avg: 3.2x ROI
Top quartile: 6x+
Red flags
- ROI < 2x after 90 days
- Cost rising faster than output gains
Key metrics
- Cost per tool per engineer (monthly)
- Time saved value (hours saved × loaded cost)
- Net ROI multiplier
Developer Experience Surveys
The Qualitative Layer
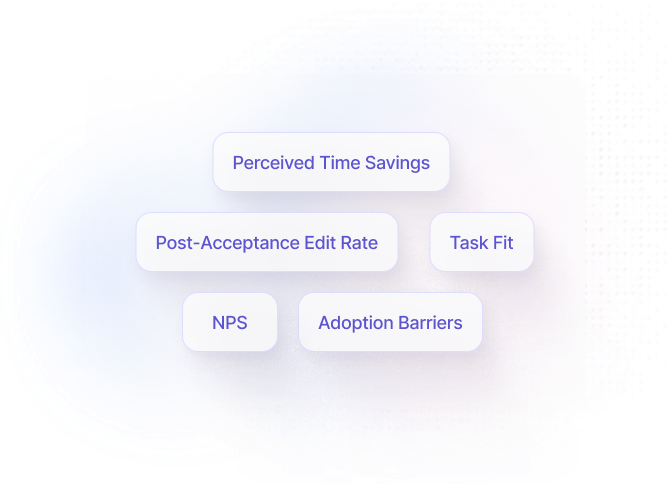
Telemetry tells you what happened. Surveys tell you why. No amount of usage data can capture whether developers feel AI tools save them time, which tasks AI fits best, or what barriers prevent deeper adoption.
Scout’s built-in developer surveys are benchmarked against industry data, so you know exactly where your org stands compared to peers. Surveys run quarterly and cover five core dimensions:

AI is reshaping your workforce.
Are you measuring what’s changing?
Start with a discovery call. We’ll show you how Larridin gives you complete visibility into your AI transformation in minutes, not months.