


Aggregate adoption metrics can be reassuring. They can also hide a cost distribution that changes sharply from week to week—and whether high spend is generating value.
Key Takeaways
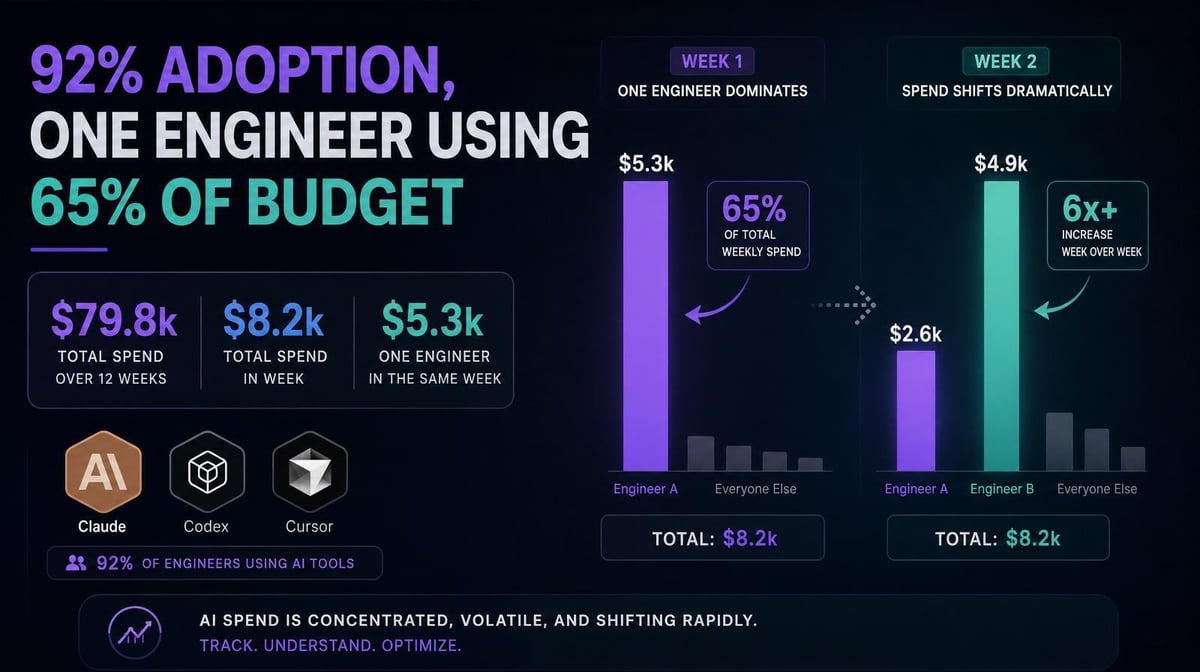
- In a Larridin customer’s engineering organization, AI tool spend across Claude, Codex, and Cursor totaled $79.8k over 12 weeks. In one week, a single engineer accounted for $5.3k of the $8.2k total, or roughly 65% of weekly spend.
- OpenAI’s State of Enterprise AI 2025 report found that frontier workers at the 95th percentile sent 6x more messages than the median worker. In coding tasks, the gap reached 17x. That shows how uneven usage intensity can be, not whether the additional activity produced proportionate value.
- Cost concentration isn’t automatically a problem. Leaders need to connect per-user spend with durable output, delivery performance, and business impact before deciding whether they’ve found a power user, an experimenter, or a governance issue.
What the Customer Data Actually Shows
A 92.4% weekly active user rate shows broad participation in a Larridin customer’s engineering organization. It doesn’t show whether people are using AI at anything close to the same intensity.
Across 12 weeks, the organization spent $79.8k on Claude, Codex, and Cursor. In one week, a single engineer accounted for $5.3k of the $8.2k total. The following week, that engineer’s spend fell by half while another engineer’s spend jumped more than 6x.
The AI adoption rate couldn’t show that shift in who was driving the spend. A leader looking only at weekly active users would see broad adoption, but miss that most of one week’s spending came from one person and that the concentration moved the next week.
OpenAI’s enterprise data shows a related pattern in usage intensity. Frontier workers sent 6x more messages than the median worker, and the coding gap reached 17x. Message volume isn’t a measure of value or cost, but it confirms that activity can be highly uneven beneath an organization-wide adoption number.
Our companion article examines the 6x productivity gap inside your own organization and what leaders should learn from power users.
Concentration Isn’t Automatically a Problem
Uneven usage is a fact to investigate, not a reason to cap everyone’s usage. High spend can reflect valuable work, expensive experimentation, inefficient tool use, or activity outside approved systems. The concentration figure alone can’t distinguish among them.
The real question is what the spend produced. Did it lead to durable code, faster delivery, or work with measurable business value? Did it fund a useful experiment? Or did it generate activity that never shipped and couldn’t be tied to an approved initiative?
One engineer driving 65% of a week’s spend could represent several very different patterns.
3 Cost Concentration Patterns to Watch
1. Productive Concentration: The Power User
High spend paired with high-value output, strong code durability, and downstream impact is a pattern to understand and replicate. AI proficiency data can show what effective users do differently, giving leaders evidence for coaching and training instead of anecdotal “best practices.”
2. Exploratory Concentration: The Experimenter
High spend may support prototype development, model testing, or complex work that doesn’t immediately reach production. That isn’t necessarily waste. But it should be identified and budgeted as experimentation rather than counted as proven productivity ROI.
Leaders still need to set guardrails: an owner, a defined objective, a time window, and a decision about what happens after the experiment.
3. Ungoverned Concentration: The Invisible Spender
Using AI outside approved tools or accounts, often called shadow AI, creates a separate governance concern. Writer’s 2026 enterprise AI adoption survey found that 67% of executives believed their company had already suffered a data leak or breach because an employee used an unapproved AI tool.
That finding doesn’t make cost concentration a breach indicator. It shows why organizations need to know when unusually high usage is happening outside approved systems rather than discovering it after a security or finance review.
The Measurement Layer That Makes Concentration Visible
Weekly active users, seat counts, and total invoices each answer a different question. None shows which person used which tool, what the activity cost that week, or what it produced.
A useful cost view needs four pieces of context:
- Who generated the spend?
- Which tool, model, agent, or workflow generated it?
- What output or business outcome did it support?
- Did the output ship, hold up, and justify the cost?
Token Spend & Insights consolidates AI spending across tools and attributes it to teams, agents, and use cases. Larridin’s AI Dev Productivity platform adds engineering output and quality measures, including code durability. Together, those views help leaders decide whether concentrated spending is producing proportionate value.
Frequently Asked Questions
Should we be concerned if one engineer accounts for 65% of weekly AI spend?
Not based on the percentage alone. High spend may signal a valuable power user, a legitimate experiment, inefficient usage, or activity that needs AI governance review. Compare the cost with output quality, durability, delivery results, and the purpose of the work.
Why do aggregate AI adoption rates hide cost concentration?
Adoption metrics measure participation. A 92.4% weekly active user rate means most of the group used an AI tool during the week, but it doesn’t show how much each person used it or how the spending was distributed. Broad adoption and concentrated cost can exist at the same time.
How do we know whether one person’s high AI spend is justified?
Connect the spend to what the person produced. Look at durable output, shipping velocity, quality, rework, and business impact. High spending can be justified when the value is proportionate and the activity fits an approved objective.
What is the difference between a power user and a wasteful high spender?
The evidence around the spend. A power user converts higher usage into valuable, durable outcomes. A wasteful high spender consumes resources without proportionate output or learning. An experimenter may sit between them, generating useful evidence even when the immediate output doesn’t ship.
See the Concentration Behind Your Adoption Number
Larridin’s per-engineer spend view reveals the concentration behind aggregate adoption numbers and connects it with engineering output and quality.
Book a discovery call to see whether your highest AI spend is producing proportionate value.