


TL;DR
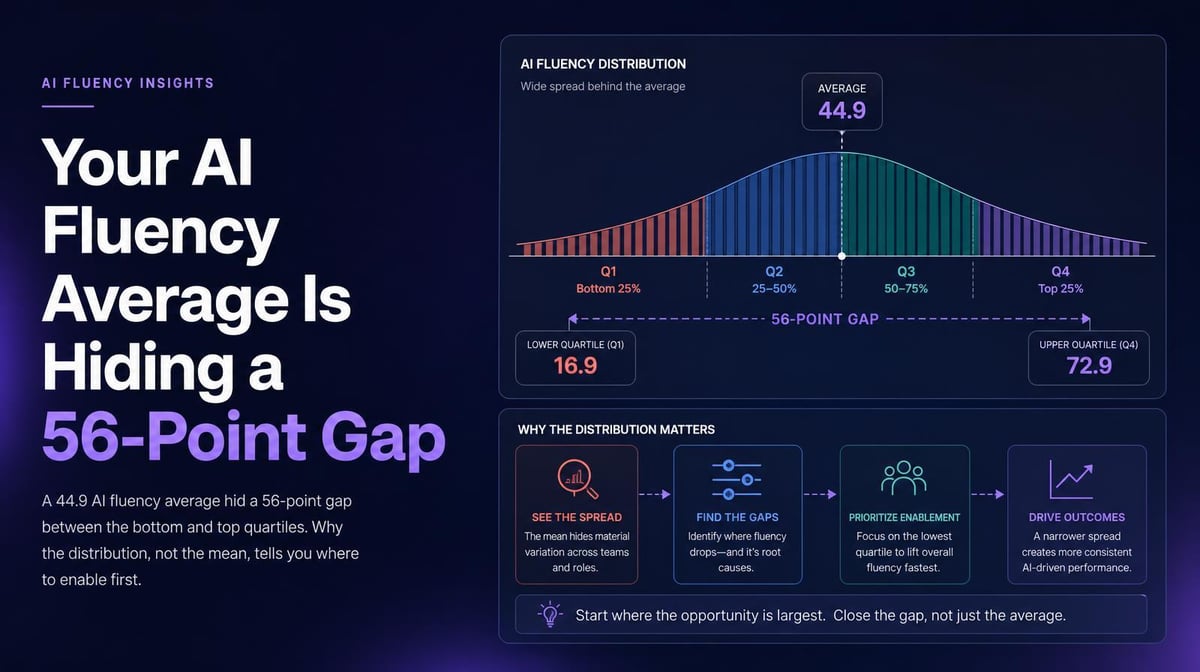
Short answer: A single AI fluency score averages strong and weak users into a misleading number. Report the spread instead: the 25th, 50th, and 75th percentiles, plus how many people are at each fluency level. In Larridin’s own instance, a 44.9 average hid a 56-point gap between quartiles.
Key wins:
- See where AI fluency is strongest and where people need support.
- Target enablement by department and skill dimension, not company-wide.
- Track movement between fluency levels week over week.
Who it’s for: CHROs, CAIOs, and L&D leaders who own AI enablement.
What’s a Spark Insight? Sparks are short, data-backed findings Larridin surfaces from how AI is actually used across an organization. This post expands on one of them.
Quick Answers
If you’re asking… | The answer |
|---|---|
What is an AI fluency score? | A behavioral measure of how well and how broadly people use AI. It’s built from signals like usage volume, prompt quality, and use of advanced features. |
Why isn’t the average enough? | It hides the distribution. Two companies with the same average can have very different gaps between their strongest and weakest users. |
What should I report instead? | P25, P50, and P75, plus headcount by fluency level (for example, Explorers vs. Multipliers), trended weekly. |
Where do I start enablement? | With the bottom quartile and the departments weakest on specific dimensions, such as advanced usage or prompt quality. |
What We Hear From Leaders
- Our AI fluency is in the mid-40s. That seems fine for year one.
- Everyone’s active, so everyone’s learning.
An average can’t tell you either of those things.
What you struggle with | What you need | How Larridin helps |
|---|---|---|
One fluency number on the scorecard | The shape of the distribution | Fluency Overview shows P25, P50, and P75 |
Can’t tell beginners from multipliers | Headcount by fluency level, week over week | Fluency levels track movement between tiers |
Company-wide training that fits no one | Department scores by dimension | Breakdowns by volume, quality, and advanced usage |
The Data: 44.9 Average, 56-Point Spread
We run Larridin on ourselves. In our own instance, the AI Fluency Score came out at 44.9, a respectable-looking midpoint. The percentiles told a different story:
- P25: 15.7
- P50: 55.0
- P75: 72.1
That’s a 56-point gap between the 25th and 75th percentiles. The median is above the average, which suggests lower scores are pulling the mean down.
Fluency levels make it concrete. Of 33 people in the latest week, 15 were Explorers, up 4 from the week before. Only 5 were Multipliers, flat week over week. Across the organization, sessions averaged just 2.1 turns.
Departments split further. Engineering scored 73.1, with Advanced Usage at 95.6 and Volume at 80.0, but Quality at 51.1. Sales scored 40.0, with Advanced Usage at just 20.0.
Sample note: 33 people in one company. The pattern is the point, not the specific scores.
Why Does the Distribution Matter More Than the Average?
Multipliers may chain tasks, use agents, and build reusable prompts, while Explorers may rely on simpler interactions. Averaging their scores hides differences in how people use AI and where they may need support. Unlike AI confidence surveys, fluency scores reflect observed usage rather than self-reported perceptions.
The spread also tells you what kind of problem you have. A tight distribution around a low score suggests a company-wide skills gap. A wide one, like the example above, suggests pockets of real fluency that haven’t spread.
What Do the Department Dimensions Add?
They show which skill to investigate. Engineering scored 95.6 on Advanced Usage but only 51.1 on Quality, suggesting a need to examine its quality-related practices. Sales scored just 20.0 on Advanced Usage, making connectors, agents, and role-specific workflows worth exploring. One training program for both teams could miss their different needs. Skill scores also don't necessarily predict AI leverage, so it's worth comparing both.
How to Measure AI Fluency Without Averaging It Away
- Report percentiles. Publish P25, P50, and P75 next to the average every month.
- Count people by level. Track how many people are at each fluency level and how many moved up or down this week.
- Watch session depth. Turns per session is a simple signal for one-and-done usage.
- Split by dimension. Break department scores into volume, quality, and advanced usage.
- Enable the bottom quartile first. Pair low scorers with Multipliers in their own department and re-measure in four weeks. Look for AI adoption bright spots in higher-performing teams and test whether their practices transfer.
FAQ
What’s a good AI fluency score?
There’s no universal benchmark yet. Track your own percentiles over time and aim to narrow the gap between P25 and P75.
What’s the difference between AI fluency and AI adoption?
Adoption counts who uses AI. Fluency measures how well and how broadly they use it.
How often should we measure fluency?
Weekly for movement between levels, monthly for executive reporting.