
Enterprise AI Measurement Guide
Velocity
Quality & Work Mix
How is engineering output distributed across Hard, Medium, and Easy PR difficulty tiers, and is AI coding changing that distribution?
What it shows
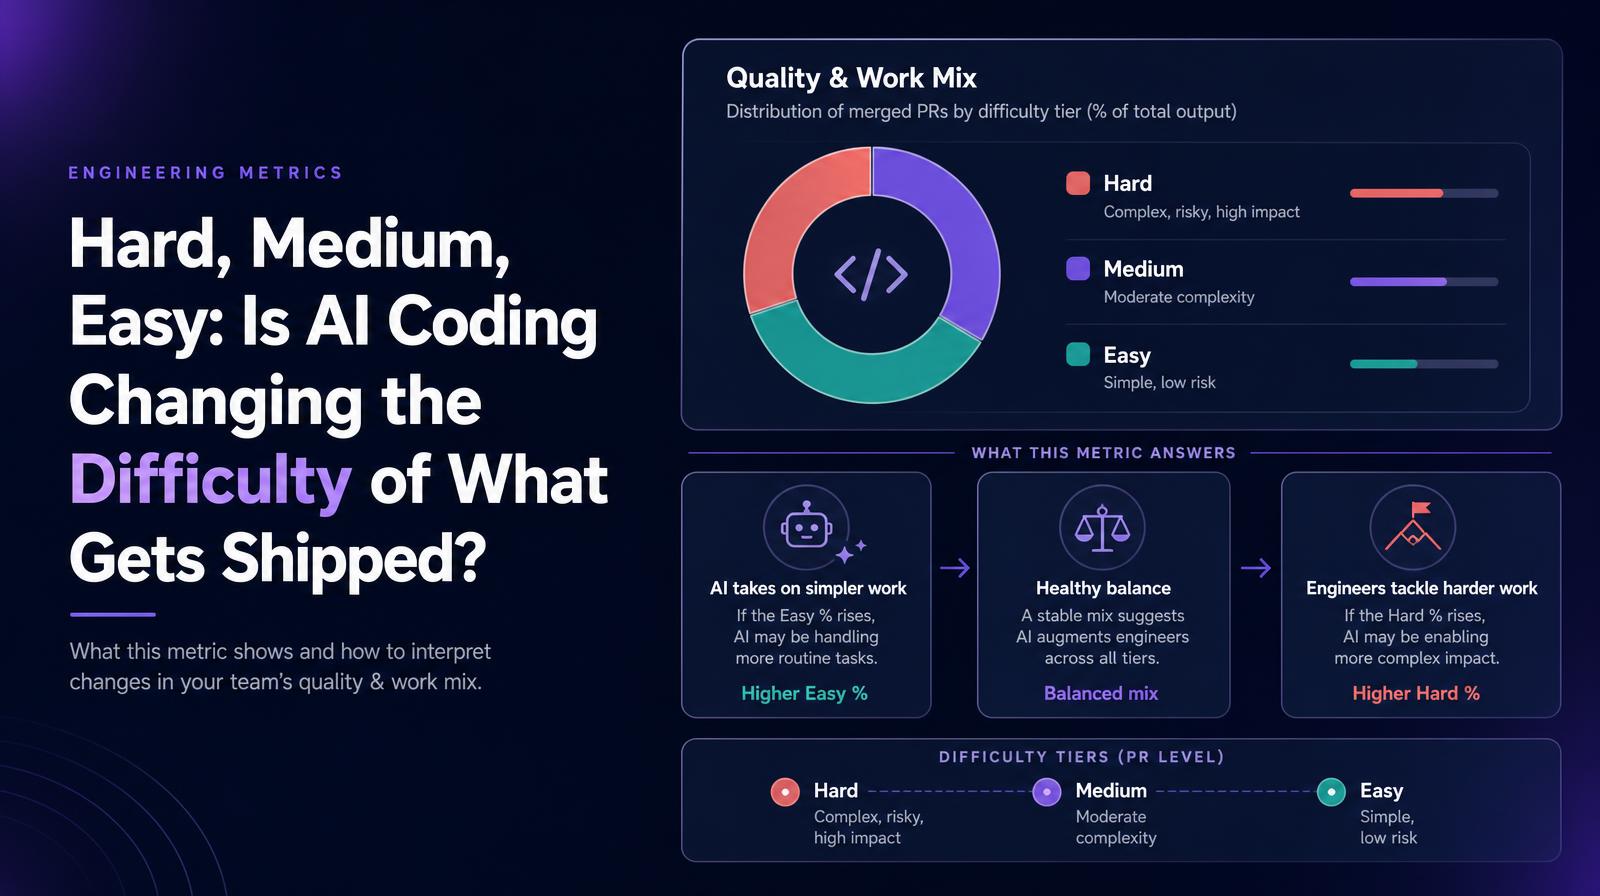
The Quality & Work Mix card shows how engineering output distributes across three PR difficulty tiers, Hard, Medium, and Easy, as a percentage of total output. It answers whether AI is changing the complexity profile of what the engineering team ships: more Easy PRs might indicate AI is handling simpler work, while a rising Hard % suggests AI is helping engineers tackle more ambitious work than they otherwise would.
Why it matters
Complexity distribution is the strategic lens that aggregate output metrics miss. A team that doubles its PR volume while the Easy % rises from 30% to 70% is producing more of less valuable work. A team whose Hard % rises while total volume grows is scaling in the direction that creates durable competitive advantage. CTOs need this view to answer the question boards are starting to ask: is AI making our engineering team more capable, or just faster at the same level of difficulty?
The Larridin angle
Larridin's difficulty classification is derived from code analysis, PR size, cyclomatic complexity signals, test coverage, and dependency scope, rather than from ticket labels or engineer self-assessment. That makes the Hard/Medium/Easy distribution a system-measured fact rather than a perception survey, and changes its usefulness from directional to actionable.
Related Velocity Metrics
Common questions
What does the Quality & Work Mix card measure?
The Quality & Work Mix card measures the distribution of engineering output across Hard, Medium, and Easy PR difficulty tiers as a percentage of total output.
How does AI impact the complexity of engineering work?
AI may be shifting the complexity profile by handling simpler tasks, indicated by an increase in Easy PRs, or enabling engineers to tackle more complex tasks, shown by a rise in Hard PRs.
Why is the complexity distribution important to the C-suite?
Complexity distribution provides a strategic view that helps determine if AI is enhancing the engineering team's capabilities or merely increasing output volume at the same difficulty level.
How does Larridin determine the difficulty of PRs?
Larridin uses code analysis, including PR size, cyclomatic complexity, test coverage, and dependency scope, to classify PR difficulty, making it a system-measured fact rather than a subjective assessment.