
Enterprise AI Measurement Guide
Team Performance
Performance Overview Chart
How do Output and AI Code Share trend together in the Performance Overview chart, and what does their relationship show?
What it shows
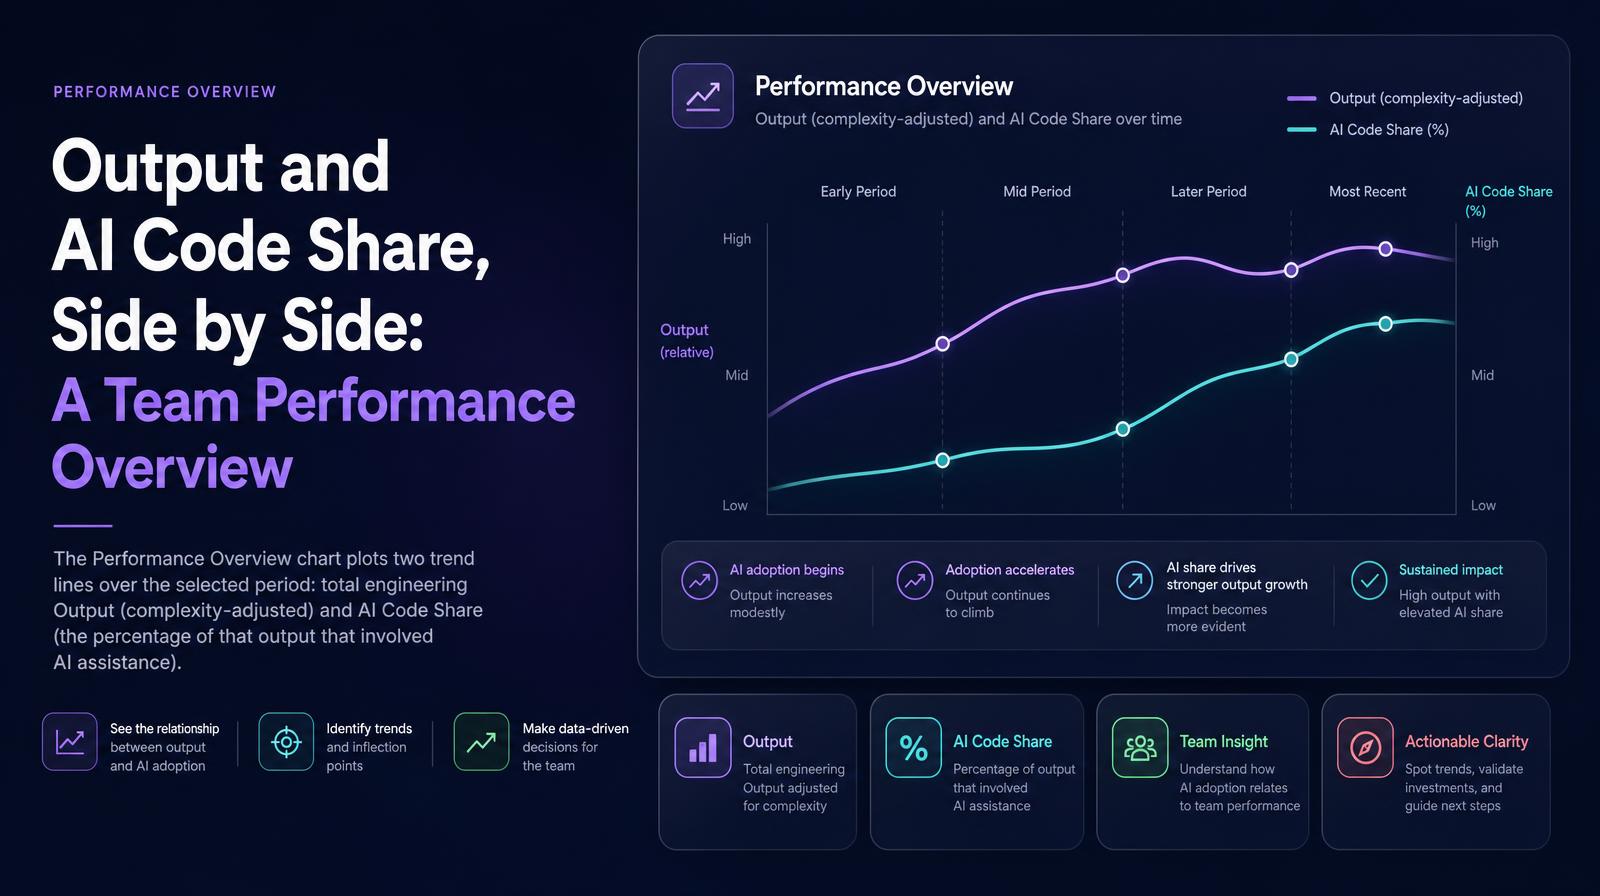
The Performance Overview chart plots two trend lines over the selected period: total engineering Output (complexity-adjusted) and AI Code Share (the percentage of that output that involved AI assistance). Displaying both on the same chart makes the relationship between AI adoption and output change immediately visible, whether Output rises alongside AI Code Share (AI is contributing), stays flat (AI is running parallel without lifting output), or diverges (one moving while the other doesn't).
Why it matters
The single most important question in AI-assisted engineering is whether AI Code Share growth translates to Output growth. The Performance Overview chart answers that question visually and continuously. A team where both trend lines move up together has demonstrated that AI is genuinely contributing to what ships. A team where AI Code Share rises while Output stays flat has a proficiency or workflow integration problem, not a tool problem. The chart makes that diagnostic immediate without requiring a separate analysis.
The Larridin angle
Larridin's complexity-adjusted Output metric ensures that the Output trend line reflects genuine engineering value rather than PR volume. This is critical alongside AI Code Share: a team could show rising AI Code Share and rising raw PR counts while actual output value stays flat, if AI is being used for simpler tasks. Larridin's Output metric cannot be inflated by volume, so the two trend lines together tell the honest story.
Related Team Performance Metrics
Common questions
What does the Performance Overview chart display?
The chart displays trend lines for total engineering Output and AI Code Share over a selected period, illustrating the relationship between AI adoption and output changes.
Why is the Performance Overview chart important for the C-suite?
It visually answers whether AI Code Share growth translates to Output growth, helping diagnose if AI is effectively contributing to engineering output.
How does Larridin ensure the Output metric is accurate?
Larridin uses a complexity-adjusted Output metric, ensuring the trend line reflects genuine engineering value rather than inflated PR volume.
What can be inferred if AI Code Share rises but Output remains flat?
This indicates a proficiency or workflow integration issue, as AI is not effectively contributing to increased engineering output.