
Enterprise AI Measurement Guide
AI Spend Intelligence
Team Level Breakdown
How do we identify which engineers are generating the most AI tool spend, and whether that spend is producing proportionate output?
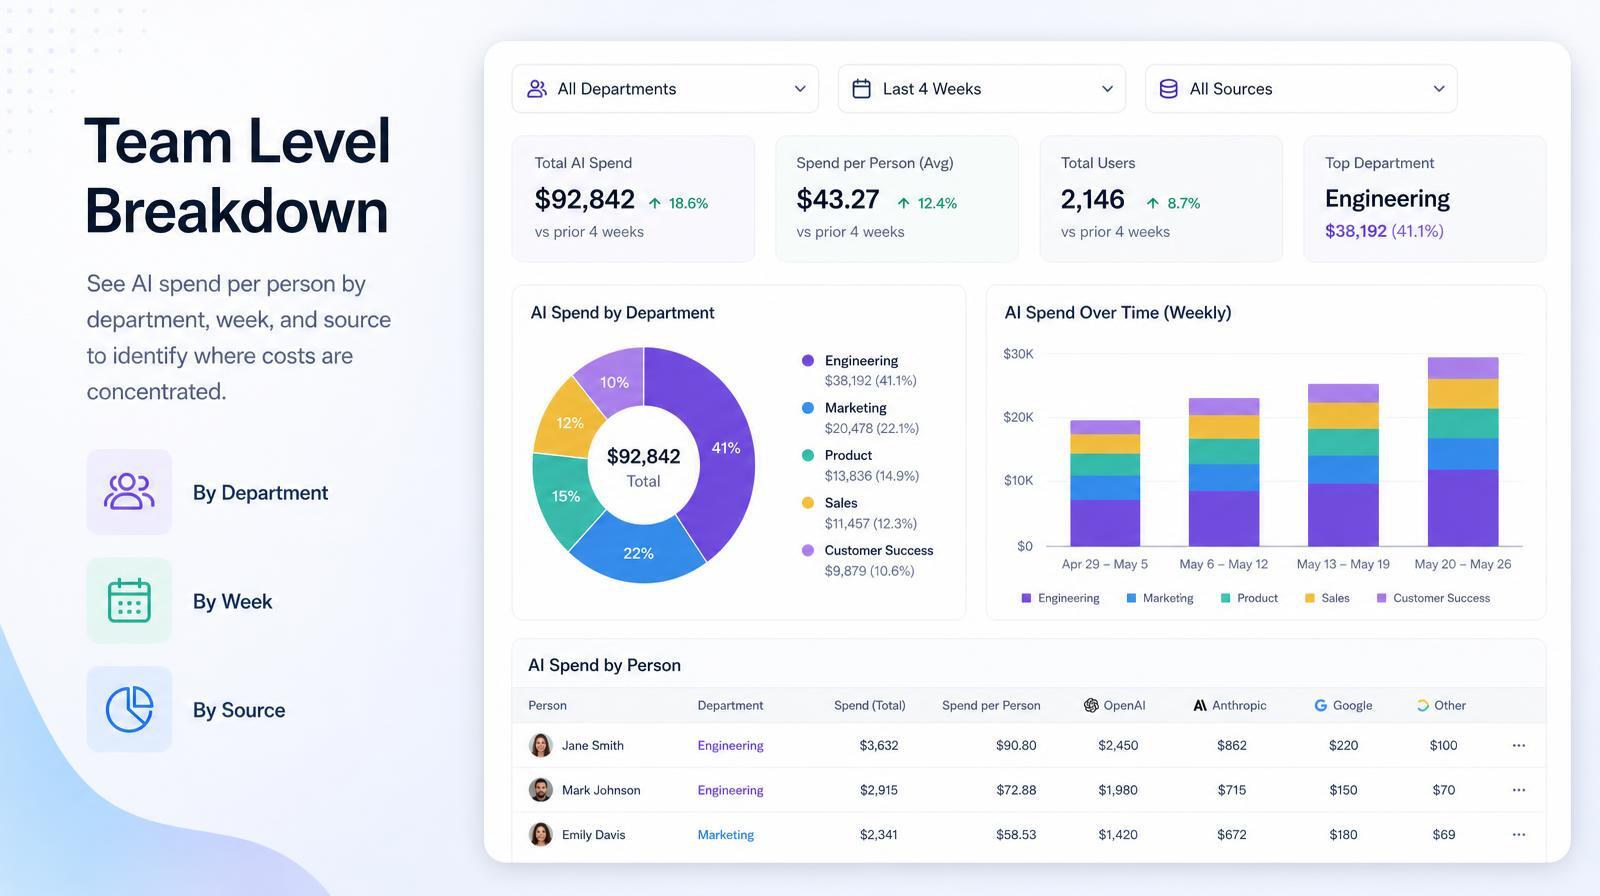
What it shows
The Team Level Breakdown table takes total AI spend down to the per-engineer level, showing each individual contributor's department, total cost over the period, and a weekly $ column for each week in the window. The table is filterable by source, so leaders can see how much any individual engineer spent on Claude specifically, or on Codex, independent of their total.
Why it matters
Per-seat pricing creates a dangerous illusion: it implies usage distributes roughly evenly across the team. It doesn't. In practice, a handful of engineers drive most of the actual spend, and those same engineers may be driving most of the output, or they may be generating cost without proportionate value. Without per-person spend data, the CFO can't answer whether that concentration is productive. Larridin surfaces both the cost and the output in the same view.
The Larridin angle
Larridin's Team Level Breakdown is the bridge between AI spend and AI productivity. The same engineer who appears in the cost table also appears in the Team Performance output table, making cost-per-output calculations possible at the individual level rather than only at the org level.
Related AI Spend Intelligence Metrics
Common questions
How can the Team Level Breakdown help us understand AI spend distribution?
The Team Level Breakdown provides a detailed view of AI spend per engineer, including department, total cost over a period, and weekly expenditure. It allows leaders to filter by source, such as Claude or Codex, to see specific spending patterns and identify where costs are concentrated.
Why is it important to analyze AI spend at the individual engineer level?
Analyzing AI spend at the individual level is crucial because aggregate data can obscure spending concentration. Identifying whether a few engineers are responsible for most of the costs helps determine if the expenditure is productive or if adjustments are needed.
What insights can be gained by using the source filter in the Team Level Breakdown?
The source filter allows leaders to isolate and examine AI spend by specific tools like ChatGPT or OpenAI Platform. This helps in understanding which tools are driving costs and enables more informed decisions about tool usage and budget allocation.
How does the Team Level Breakdown facilitate cost-per-output calculations?
By linking individual engineer costs to their output in the Team Performance table, the Team Level Breakdown enables precise cost-per-output calculations. This connection helps assess the productivity and value generated relative to the expenditure at a granular level.