
Enterprise AI Measurement Guide
AI Spend Intelligence
Spend by Source
How do we track which AI tools and platforms are driving our spend week by week, rather than discovering shifts at month-end billing?
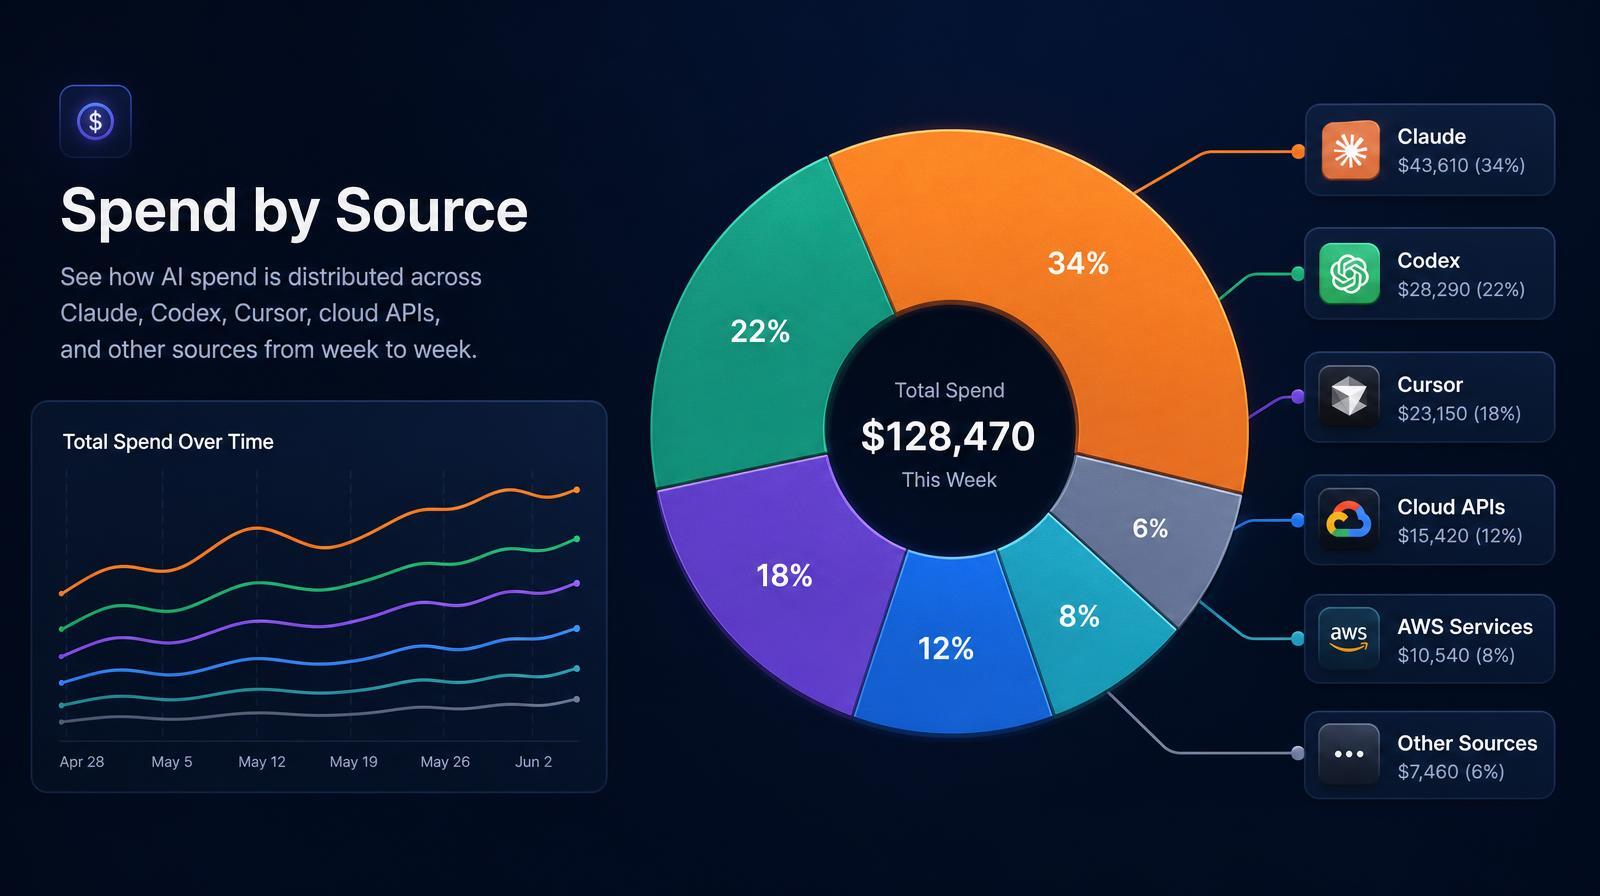
What it shows
The Spend by Source chart breaks total AI spend into weekly bars by platform, showing exactly how much of the budget is going to each source (Claude, Codex, Cursor, OpenRouter, GCP Vertex, AWS Bedrock, Anthropic Platform, ChatGPT, OpenAI Platform) over the selected window. It makes vendor mix shifts visible in real time rather than discoverable only at month-end reconciliation.
Why it matters
Aggregate AI spend numbers lie. A "flat" or "declining" total can mask a 14x spike in one tool that's offset by another tool dropping off. Vendor migrations, such as switching from GCP Vertex to AWS Bedrock or from Codex to Claude, can happen mid-quarter and shift budget assumptions entirely without anyone in finance noticing until the next invoice cycle. The Spend by Source chart is the layer that makes those shifts visible while there's still time to act.
The Larridin angle
Most AI billing dashboards show spend by tool from a single vendor's perspective. Larridin aggregates across all sources simultaneously: cloud APIs, coding agents, and consumer-tier tools, giving a cross-vendor view no individual vendor dashboard can produce.
Related AI Spend Intelligence Metrics
Common questions
How can the Spend by Source chart help us manage our AI budget more effectively?
The Spend by Source chart provides a weekly breakdown of AI spend by platform, allowing you to see shifts in vendor usage and budget allocation in real time. This visibility helps manage budget assumptions and avoid surprises at month-end billing.
What specific platforms does the Spend by Source chart track?
The chart tracks spend across multiple platforms, including GCP Vertex, AWS Bedrock, OpenAI Platform, Codex, Anthropic Platform, Cursor, OpenRouter, ChatGPT, and Claude, offering a comprehensive view of AI tool usage.
Why might a stable total AI spend mask underlying changes in platform usage?
A stable total AI spend can mask significant shifts if one platform's increased usage is offset by another's decline. The Spend by Source chart reveals these changes, allowing for timely investigation and adjustment.
How does Larridin's approach differ from individual vendor billing dashboards?
Larridin aggregates spend data across all AI sources simultaneously, providing a cross-vendor view that individual vendor dashboards cannot offer, thus enabling a more comprehensive analysis of AI spend.