
Enterprise AI Measurement Guide
AI Spend Intelligence
Source Cost Table
How do we get a precise, source-by-source AI spend breakdown in a format finance can use to build budget models and board reports?
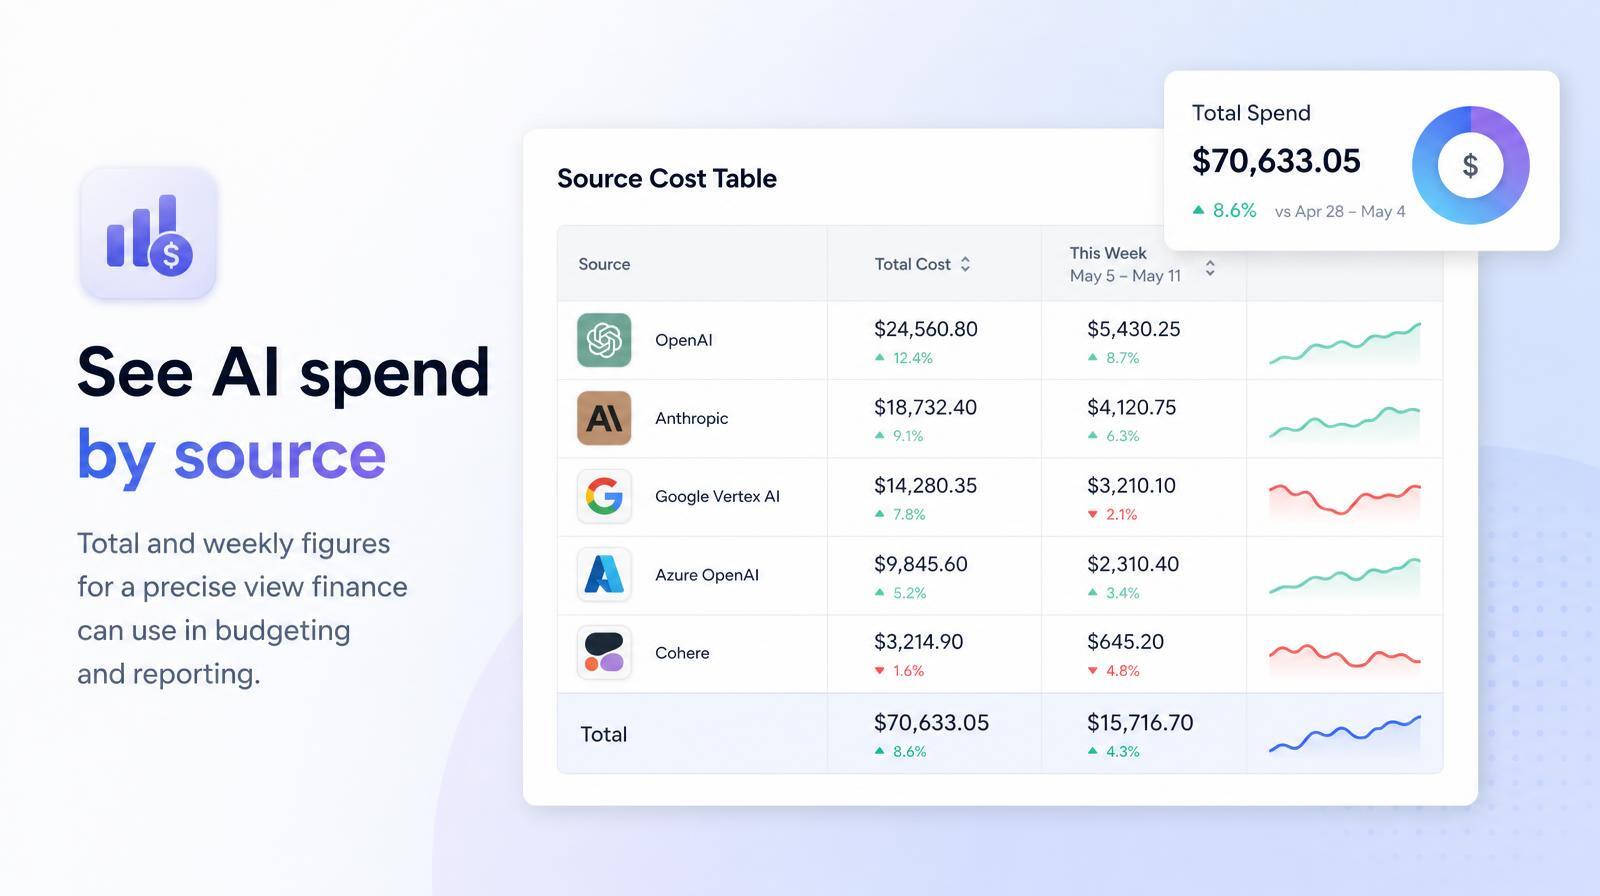
What it shows
The Source cost table is the structured data layer beneath the Spend by Source chart: a row-per-source table showing each platform's total spend over the selected period, broken down into weekly columns. It allows precise comparisons across sources and enables finance teams to build their own cost models from the underlying weekly data rather than reading from a chart.
Why it matters
Finance teams need numbers, not charts, when they're building budget models or explaining AI spend to a board. The Source cost table gives them the raw weekly figures by platform. The same data shows when Codex spend went from $710 to $10,115 in a single week, or when GCP Vertex quietly overtook every other source without anyone noticing.
The Larridin angle
The weekly column structure makes it possible to spot intra-period acceleration. A tool whose spend jumped 3x in week 8 of a 12-week period would average out to look flat on a monthly view. Larridin's weekly granularity preserves that signal.
Related AI Spend Intelligence Metrics
Common questions
How does the Source Cost Table assist in identifying spending trends?
The Source Cost Table provides a weekly breakdown of AI spend by platform, allowing finance teams to detect spending trends that might be obscured in aggregate monthly totals. This granularity helps in identifying sudden increases or decreases in spending that are crucial for accurate budget modeling and reporting.
What advantage does the weekly column structure provide over monthly reporting?
The weekly column structure allows finance teams to spot intra-period changes, such as sudden spikes or drops in spending, which might average out in monthly reports. This detailed view ensures that significant fluctuations are not overlooked, aiding in more accurate financial analysis and decision-making.
How can the Source Cost Table improve budget model accuracy?
By providing exact weekly figures for each AI source, the Source Cost Table enables finance teams to build detailed budget models based on precise data rather than estimates. This accuracy is essential for forecasting and explaining AI spend to stakeholders.
In what ways can finance teams utilize the per-source rows in the Source Cost Table?
Finance teams can use the per-source rows to compare total spend and week-over-week changes across different AI platforms. This comparison helps in understanding the relative performance and cost impact of each platform, facilitating informed budgeting and resource allocation.