


Larridin
TL;DR
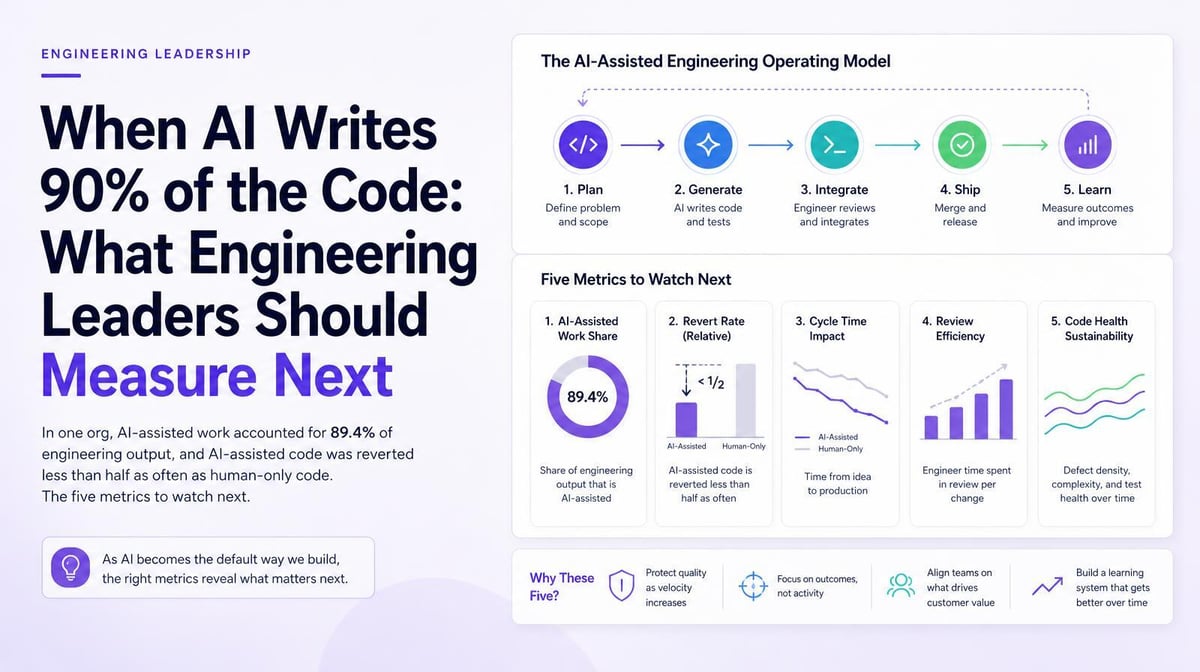
Short answer: Once AI is involved in most of your engineering output, “how much is AI?” is no longer a useful question. The questions that matter are whether that code sticks, what it’s being spent on, and whether review still catches problems. Track five metrics: AI output share, revert rate split by AI vs. human, code turnover, work mix, and review depth.
Key wins:
- Replace anecdotes about “AI slop” with a measured quality comparison.
- See whether AI capacity goes to features or maintenance.
- Catch review erosion before it shows up as incidents.
Who it’s for: CTOs, VPs of Engineering, and platform leaders.
What’s a Spark Insight? Sparks are short, data-backed findings Larridin surfaces from how AI is actually used across an organization. This post expands on one of them.
Quick Answers
If you’re asking… | The answer |
|---|---|
How much engineering output can involve AI? | In one customer’s instance, 89.4% of engineering output over 12 weeks was AI-assisted, with 72% of engineers using AI coding tools weekly. |
Does more AI code mean lower quality? | Not necessarily. In that instance, AI-assisted code was reverted at 1.24% within 30 days vs. 2.69% for human-only code. |
What should I measure after adoption? | Revert rate split, code turnover, work mix (features vs. bugs vs. KTLO), and review depth by team and repo. |
How do I know if quality flips? | Track the same split over 30 and 90 days. A widening or reversing gap shows which teams and repos generate the noise. |
What We Hear From Leaders
- It’s fast, but is it slop?
- The last AI PR I reviewed was a mess, so I assume most of them are.
Both are reasonable instincts. Neither is a measurement.
What you struggle with | What you need | How Larridin helps |
|---|---|---|
Quality debates run on anecdotes | Revert rate split AI vs. human | Code Revert Rate on the Engineering Overview, over 30 and 90 days |
Unclear where AI capacity goes | Output by work type | Innovation Rate: features vs. bug fixes vs. KTLO |
Review may be rubber-stamping AI code | Signals of review engagement | Quality tab: Rubber Stamp Rate, Substantive Comment %, code turnover |
The Data: 89% AI Output, Half the Reverts
In one customer’s instance over 12 weeks:
- AI Output Share: 89.4%
- Engineers using AI coding tools weekly: 72%
- 30-day revert rate: 1.24% AI-assisted vs. 2.69% human-only
- 90-day revert rate: 1.27% AI-assisted vs. 3.49% human-only
- Work mix: 69% features, about 16% bug fixes, 14% KTLO
AI-assisted code had less than half the revert rate of human-only code, and the gap widened over the longer window. Most output went to features.
That’s one instance, not a rule. In a different customer’s instance, AI Code Share and output per engineer both rose while 30-day code turnover climbed 64.7% and PR cycle time jumped 138.7%. More output, but rising turnover and longer PR cycle times. That’s why the split has to be measured in your own org.
Why Isn’t AI Output Share Enough?
Share tells you volume, not value. The same distinction applies to PR counts. Industry research points the same way: the 2025 DORA report found AI acts as an amplifier, helping teams with strong systems and doing little for teams without them. RedMonk’s review notes the report found AI adoption associated with rising delivery instability. High AI share can sit on top of either outcome.
Which 5 Metrics Matter Most After 80% AI Share?
- AI output share. Keep it as context for everything else.
- Revert rate, split. AI-assisted vs. human-only, at 30 and 90 days, by team and repo.
- Code turnover. Code rewritten or reverted within a month of landing. Rising turnover means output isn’t sticking.
- Work mix. Share of output going to features, bug fixes and KTLO. AI that only makes maintenance cheaper won’t move the roadmap.
- Review depth. Rubber Stamp Rate and Substantive Comment %. When AI contributes to most engineering output, review is a critical quality gate. Faster generation can also create a code review bottleneck.
Rising turnover can also affect the ROI of AI code quality.
How to Set This Up
- Tag every commit and PR as AI-assisted or human-only.
- Baseline the revert split for the last 90 days before drawing conclusions.
- Slice by team and repo. Org-level averages hide the one repo generating most reverts.
- Add review signals next to output metrics on the same dashboard.
- Review monthly, and set an alert if the AI revert rate crosses the human rate in any repo.
FAQ
What percentage of code is AI-generated in most companies?
It varies widely by team and tooling. Measure your own AI Code Share instead of relying on public estimates.
Is AI-generated code more likely to be reverted?
In the instance above it was less likely. In others the picture differs, which is the argument for measuring the split.
What is code turnover?
The share of new code rewritten or reverted within a set window, usually 30 days. It’s an early signal that output isn’t sticking.
Spark a discussion that moves your AI strategy forward. [Get your first Sparks]
Sources
- Announcing the 2025 DORA Report, Google Cloud
- DORA 2025: Measuring Software Delivery After AI, RedMonk