

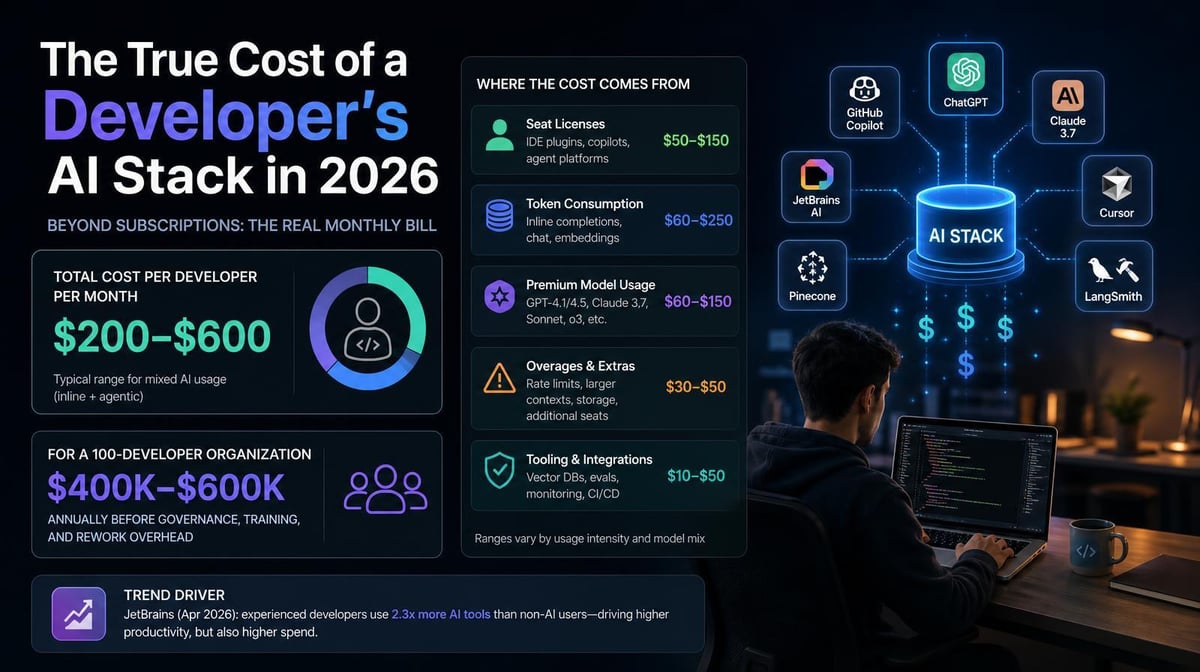

A developer's AI stack can combine fixed access, included capacity, credits, and variable consumption across several tools. The pricing page establishes the starting commitment. It does not show how the cost is distributed once different developers and workflows use the stack.
The financial question has two parts: which layers support software delivery, and which users or workloads generate their costs? Map both before replacing seat-price arithmetic with another broad average.
Key Takeaways
- Fixed access and metered consumption need separate records, with included usage reconciled against actual bills.
- Low-use access, regular multi-tool work, and sustained agent execution can coexist in one team with very different cost patterns.
- The software-development AI stack extends beyond editors and terminal agents into review, security, tests, knowledge, infrastructure, measurement, and governance.
- Use those layers as an inventory checklist, not a requirement to buy fourteen products.
- Spend concentration is a signal to investigate, not proof that a heavy user is inefficient. Compare it with accepted work, quality, and full workflow effort.
Why Average Cost per Developer Can Mislead
Headcount multiplied by seat price assumes similar cost behavior. AI stacks can combine predictable subscriptions with pooled credits, model allowances, APIs, cloud charges, and agents that continue executing after an initial request.
Two developers with the same assigned tools can therefore generate different bills. Model selection, repository size, task mix, context, retries, concurrency, and automation all affect consumption.
Anthropic's Claude Code cost documentation discusses this variation and recommends a pilot baseline. Provider averages can help frame scenarios; they are not universal costs for Copilot, Cursor, Claude Code, or a combined stack.
The attribution guide reports one Larridin customer environment in which an engineer generated 65% of team AI spending in one week while several teammates spent between $0 and $300. That example is environment-specific, not an industry distribution. It illustrates why a correct average can still conceal the workload driving the bill.
Inventory the Layers Behind the Price
The software-development AI stack guide describes fourteen functional layers. A tool may cover several layers, and a team may not need a dedicated product for each.
| Layer | Role in the Workflow | Cost Question |
|---|---|---|
| 1. AI IDE or pair programmer | Completion, explanation, editing, debugging, and tests | Which seats and included or metered models are used? |
| 2. Terminal coding agent | Repository exploration, changes, commands, and validation | What do sessions, models, and parallel instances consume? |
| 3. Autonomous development agent | Assigned work leading to changes or PRs | What do completed, failed, and abandoned runs cost? |
| 4. AI code review | Quality and maintainability checks | Is review bundled, per-seat, or separately metered? |
| 5. AI security | Vulnerabilities, dependencies, secrets, and risk checks | What tooling and human remediation costs apply? |
| 6. Testing and QA | Test generation, execution, and maintenance | What additional CI, validation, and recovery resources are used? |
| 7. Documentation and knowledge | Codebase context and maintained reference material | What access, indexing, and maintenance effort is required? |
| 8. Context and connectivity | Repositories, tickets, databases, documents, and tools | What integration, permission, and support costs are created? |
| 9. Model access and infrastructure | APIs, routing, gateways, caching, and logs | How are model and supporting cloud charges reconciled? |
| 10. Developer productivity measurement | Delivery, quality, and developer experience | What platform and analyst effort supports the evidence? |
| 11. ROI measurement | Connecting costs with attributable outcomes | What is measured, estimated, or still missing? |
| 12. Workflow mapping | Transitions, bottlenecks, and process changes | What collection and analysis effort is needed? |
| 13. Usage, cost, and token management | Budgets, consumption, and allocation | Who owns the charge, workload, and intervention? |
| 14. Governance and compliance | Approved tools, access, data handling, and audit records | What controls, reviews, and ongoing administration apply? |
The source names examples such as Cursor, Copilot, Claude Code, CodeRabbit, Semgrep, Langfuse, Helicone, and measurement platforms. These are illustrative roles, not a product ranking or assurance that every vendor has identical coverage. Verify packaging and integrations for the actual deployment.
A purchased subscription may already include review or another capability. Shared infrastructure can serve multiple layers. Record the economic charge once and annotate its functions rather than add a fee for each table row.
Three Cost Profiles Within One Stack
These are diagnostic patterns, not universal spending tiers or labels for employee performance.
1. Light or Occasional Use
Fixed access may dominate the bill. Investigate overlapping licenses, role needs, onboarding, leave, task fit, and reporting gaps. Low activity does not automatically make an infrequently needed tool wasteful.
2. Regular Multi-Tool Work
A developer may combine an editor, terminal agent, review tool, and knowledge system for one task. Normalize identity, billing periods, and workloads across sources. The combined record shows what supports the workflow instead of several disconnected provider totals.
Team and repository attribution helps connect that spending with the accepted work. One developer using several tools should not be counted as several users, and the same outcome should not be credited fully to every product.
3. Heavy Agentic Consumption
Sustained sessions, parallel agents, large context, repeated tool calls, premium models, and retries can drive variable charges. Include supporting validation and infrastructure where relevant, not only the model call.
Compare expensive runs with task complexity, success, review, rework, and durable delivery. A high-cost workflow can be valuable; a low-cost one can still produce little accepted work.
Four Views That Explain the Cost Distribution
1. Fixed Access Cost
Record assigned subscriptions, tiers, commitments, renewals, and support. Separate direct developer seats from shared platform costs and document allocation. Use current contracts rather than assume a published price applies to every buyer.
2. Variable Spend by Developer, Tool, and Workload
Reconcile tokens, credits, APIs, agents, and metered infrastructure with billed charges. Included subscription consumption should not be charged again at a notional API rate. Show observed usage separately from final spending after discounts and credits.
Token Spend & Insights consolidates available sources and attribution. Shared keys, missing identifiers, and partial integrations need explicit unknown or estimated categories.
3. Spend Concentration and Variation
Keep the mean alongside a representative distribution, median or percentiles where the data supports them, high-cost workloads, and changes over time. Identify whether concentration is temporary, recurring, or accelerating.
Give authorized cost owners the granularity needed to diagnose the work, with privacy and access controls. Do not turn token burn into a productivity leaderboard.
4. Utilization and Functional Overlap
Compare what is assigned with the capabilities needed and used. An IDE and terminal agent can be complementary; two similar tools may serve distinct risk or integration needs. Validate overlap before consolidation.
Record whether a tier change, enablement, access adjustment, or retirement solves the cause. A smaller bill is not an improvement if necessary verification or valuable work is lost.
Show Broader Operating Cost Separately
The focus here is distribution of tool access and consumption. The fourteen-layer inventory also reveals costs needed for a full TCO assessment: rollout, integrations, enablement, security, monitoring, human review, remediation, and maintenance.
Keep direct vendor spending and those supporting estimates distinguishable. Apply consistent labor rates and avoid counting the same review effort under both security and quality. Separate first-year work from steady-state operations.
Connect total cost with an accepted outcome and its quality follow-up. A merged PR is an accepted artifact, not necessarily a feature in production. State the denominator and include unsuccessful work in the appropriate cost scope.
Do Not Replace Seat-Price Math With Another Average
Use vendor averages and external examples to frame possibilities. Use your own data to establish the actual mix of light access, regular workflows, and expensive execution.
Build scenarios for models, task mix, context, retries, capacity, and pricing. Review material changes with engineering and finance so the forecast reflects workload behavior rather than a uniform headcount multiplier.
Compare similar work and preserve quality and risk requirements. Cost attribution identifies what to investigate; it does not independently establish AI's causal benefit or financial ROI.
Frequently Asked Questions
What should an AI stack cost per developer?
There is no universal amount. Current contracts, included usage, model and workflow mix, agent behavior, and supporting costs determine the result. Measure the distribution, not only an average.
Does the fourteen-layer stack require fourteen purchases?
No. It describes functions. One product can cover several, some may be provided by existing systems, and others may not be needed. Count each charge once and assess gaps against the workflow.
How do we measure developers using several tools?
Map records to common identities and periods, combine direct access and consumption, and connect the workload with accepted outputs. Document shared costs and overlapping contribution.
Is a heavy user necessarily inefficient?
No. Investigate complexity, delivery, quality, retries, review, and outcomes before changing limits. High consumption is not proof of either waste or productivity.
How do we find waste?
Investigate dormant access, unjustified overlap, failed loops, abandoned work, and unexplained consumption. Different causes need different responses, from enablement to execution controls or retirement.
Do usage-management tools calculate full TCO automatically?
Not necessarily. Confirm source coverage, allocations, and labor or outcome integrations. A consolidated vendor-cost view may still omit supporting operations and human effort.
See the Distribution and the Work Behind the Stack
Larridin connects AI spending with developers, teams, agents, workflows, and use cases. Pair the cost record with delivery and quality evidence to understand which spending supports useful work.
Book a discovery call to discuss developer-stack attribution.
Inventory the functions. Reconcile the charges. Inspect the distribution. Judge cost in the context of accepted work, not the price on one seat.