

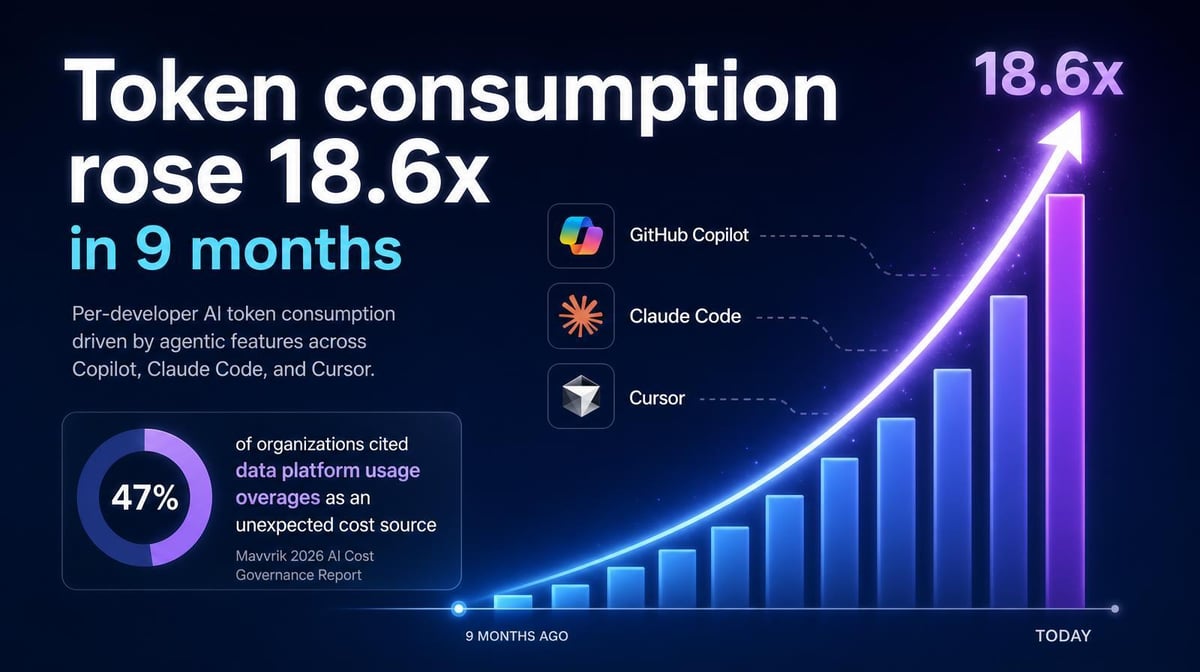

The budget for AI spend six months ago may have been built for a different kind of usage. As coding assistants add agents, tool use, reasoning, and longer workflows, there’s variable consumption in addition to a predictable seat price. The budget problem isn’t just what a token costs. It’s how many tokens the work now requires.
Key Takeaways
- Agentic workflows can drive much higher AI costs even when token prices don’t change. Budget models need to account for how the tools are actually being used, not just what vendors charge per token.
- The 2026 State of FinOps survey found that 98% now manage AI spend, up from 31% in 2024. FinOps teams still report difficulty with AI cost visibility, allocation, and value measurement.
- Average AI spend can hide major differences between users. Track consumption by tool, team, and engineer so unusual growth is visible before it distorts the budget.
Why Budget Models Break When Agentic Adoption Arrives
Early AI budgets were easier to predict because most costs were fixed subscriptions or per-seat licenses. Agentic tools make the costs more variable because each task can involve multiple model calls, retrieval, tool use, retries, and longer context.
EY’s 2026 agentic AI analysis makes the distinction clear. Its $0.04-to-$1.20 example compares two different workflow architectures: a simple chatbot interaction versus an orchestrated system that uses tools, planning, and subagents. The point isn’t that model pricing increased 30x. The work being metered became much more compute-intensive.
Seat pricing hasn’t disappeared, either. GitHub’s Copilot Business model, for example, combines a $19 monthly seat price with pooled AI credits. Usage beyond the included pool can generate additional charges when paid usage is enabled. A budget model that watches licenses but not consumption can therefore miss the variable layer growing on top of the fixed one.
That combination makes historical averages less useful on their own. Headcount can stay flat while tool mix, model choice, agent use, and task complexity change the amount of consumption generated by the same engineering team.
4 Warning Signs That Consumption Is Getting Ahead of Budget
1. Consumption Growth Keeps Outrunning the Forecast
One month of higher token use may reflect a project spike. A sustained upward trend is different. The important question is whether the forecast is being updated as the usage pattern changes.
Track growth by tool and team rather than relying only on the enterprise total. A sudden increase can come from wider adoption, a move to more expensive models, longer agent sessions, or a new workflow. Those causes have different budget implications and different responses.
2. Per-Developer Consumption Varies Widely
High variance is a warning that averages are hiding the real distribution. For example, in one Larridin customer environment, one engineer generated 65% of the team’s AI spend during one week while several others spent $0 to $300.
That concentration isn’t automatically waste. The high-spending engineer may be doing valuable, high-volume work. The question is whether that extra spending is producing proportionate value. Per-engineer attribution makes that question measurable instead of forcing managers to infer it from the team total.
3. Projected Spend Is Moving Beyond Budget
Waiting for the invoice turns a forecast problem into a postmortem. If current usage patterns point toward a material period-end overage, engineering and finance still have time to investigate the cause and decide whether the additional spend is justified.
Larridin’s Token Spend and Insights dashboard projects spend by team and flags budgets at risk before the quarter closes. The bigger benefit is having enough attribution to determine which tool, team, agent, or use case is driving it.
4. New Tool Rollouts Start Without a Consumption Baseline
A rollout without a baseline makes growth harder to interpret. You may know this month’s spend, but not whether the increase came from more users, deeper agent use, a different model mix, or a new billing structure.
Capture consumption from the start of a rollout, along with the relevant delivery and quality measures. That gives the organization a reference point for both sides of the budget question: how much consumption changed and what the additional spend produced.
Frequently Asked Questions
How do we explain rapid token consumption growth to a CFO who approved a fixed AI budget?
Separate the fixed and variable parts of the cost. The original budget may have been built around seats or subscriptions, while the actual deployment evolved toward agents and usage-based features. Show what changed in your own environment: tool mix, active users, agent adoption, model selection, and consumption by team. Then connect the added spend to delivery or business outcomes so the conversation is about value as well as variance.
What’s a realistic annual AI token consumption growth rate to plan for?
There isn’t a defensible universal rate. Growth depends on how quickly agentic workflows spread, which models teams use, the billing model for each tool, and the kinds of work being automated. Build scenarios from your own baseline instead of importing an industry multiplier. Reforecast as usage changes, especially after new tool launches or major agent rollouts.
What’s the fastest way to detect consumption growth before it hits the invoice?
Track consumption continuously at the tool and team level and project period-end spend from the current run rate. The FinOps Foundation identified granular monitoring of AI spend, including tokens, LLM requests, and GPU utilization, as the most requested missing tooling capability in its 2026 survey. Attribution then tells you what’s driving the trend so the organization can act before the billing period closes.
Does token consumption growth eventually stabilize?
It can, but stabilization shouldn’t be assumed. Absolute consumption may continue to rise as more work moves into agentic workflows even if teams become more efficient. The more useful ROI signal is whether cost per useful outcome improves over time. Track consumption alongside delivery, quality, and value rather than treating a flat token total as the goal.
Track the Growth Rate, Not Just the Current Total
Larridin’s Token Spend and Insights dashboard tracks consumption trends over time, projects potential overages, and attributes spend to the tools, teams, agents, and use cases driving it. That gives engineering and finance an early view of budget pressure and the context needed to decide whether higher consumption is producing enough value.
Book a discovery call to track your token consumption growth rate.