

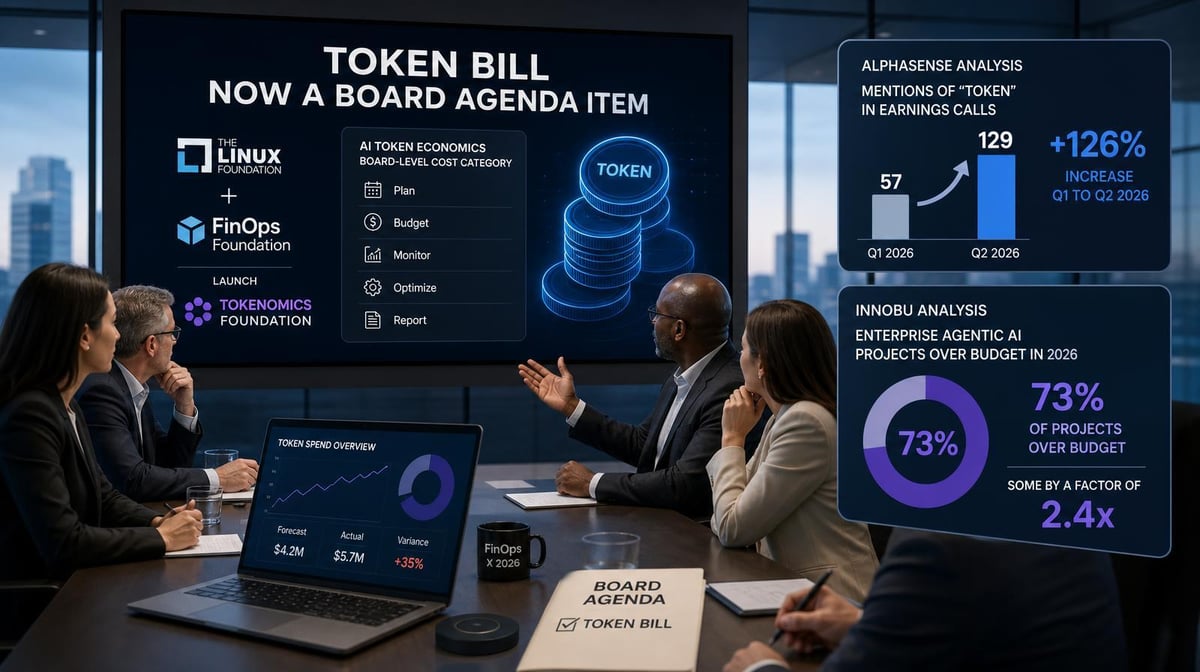

The Linux Foundation formally launched the Tokenomics Foundation in August 2026 to create shared standards for measuring AI cost, value, and ROI. Boards don’t need a raw token count. They need to know what the organization spent, who owns it, whether the budget is at risk, and what the spending produced.
Key Takeaways
- The Tokenomics Foundation’s roadmap shows where AI reporting is headed: shared cost models, value measurement, token telemetry, and ROI frameworks.
- A board-ready view should show four numbers: total AI spend, allocation coverage, projected spend versus budget, and cost per useful outcome.
- Provider dashboards show pieces of the picture. Leaders need a consolidated view across tools, models, agents, teams, and business results.
Why Token Costs Moved Into Executive Reporting
AI spending is no longer a routine software line item.
An AlphaSense analysis reported by Business Insider found that the word “tokens” was mentioned in 129 earnings calls in Q2 2026, up from 57 in the prior quarter. The shift shows that investors and executives are paying closer attention to AI economics.
The State of FinOps 2026 points in the same direction: 98% of respondents now manage AI spend, up from 31% in 2024. The report identifies visibility, allocation, and value measurement as the main challenges when teams apply FinOps practices to AI.
The industry is also starting to build common standards. On August 4, 2026, the Linux Foundation launched the Tokenomics Foundation with 30 initial member organizations. Its roadmap includes a reference model for the full cost of AI, standard methods for measuring cost to serve, frameworks that connect spending to value, and AI cost reporting through the FinOps Open Cost and Usage Specification (FOCUS).
That work is just starting, so it doesn’t create a new board reporting requirement today. It does show that companies need more than a vendor invoice and spreadsheet to manage AI cost and ROI.
The scale makes the issue more urgent. Goldman Sachs Research forecasts that agentic AI will help drive a 24-fold increase in token consumption between 2026 and 2030. Even as the cost of processing each token falls, higher usage can keep total spending rising.
4 Numbers the Board Needs to See
The board needs a small set of numbers that connect AI spending with ownership, risk, and results.
1. Total AI Spend and Trend
Start with the full amount spent across AI providers, cloud platforms, coding tools, SaaS products, agents, gateways, and other sources.
Show:
- Total spend for the current period
- The trend over the last 90 to 180 days
- Spend by business unit, team, tool, model, and use case
- The largest changes since the previous report
A single provider dashboard can only show its part of the bill. Larridin’s Token Spend & Insights brings AI spending from different sources into one model and reconciles observed usage with billed spend.
2. Allocation Coverage
A total only tells the board how much the organization spent. Allocation shows who’s responsible for it and why it exists.
Report the percentage of AI spend connected to a named team, owner, agent, project, or use case. Then show the largest unattributed cost pools.
Use allocation coverage as a practical measure of whether leaders can explain and govern the bill. The industry hasn’t set a universal benchmark, so track it against your own baseline. High spend may be justified when it supports a valuable use case. Unattributed spend is harder to defend.
3. Projected Spend Versus Budget
A board report should look forward, not just explain the last invoice.
Show:
- Actual spend versus budget
- Projected period-end spend
- Teams or tools likely to go over budget
- Material anomalies and their causes
- Unused seats or agents without an owner
- The action being taken
Larridin flags projected overages, unattributed spend, agents without owners, and dormant seats before they become larger budget problems.
4. Cost per Useful Outcome
Token counts and active seats show activity. The board also needs to see what that activity produced.
Choose an outcome that fits the use case. For engineering, that may include delivery speed, durable code, quality, rework, or cost per completed unit of work. For sales, it may include pipeline creation, deal velocity, or win rates.
Larridin’s AI Impact connects AI use with business results, while Developer Productivity connects engineering use with delivery speed, cycle time, quality, and code durability.
The board-level question is simple: did the organization get enough useful value to justify the cost, and is that return improving?
How to Build the Reporting View
Most organizations won’t get these four numbers from one invoice. Build the view in stages:
- Consolidate spend and usage data across providers and tools.
- Map spending to teams, agents, projects, and use cases.
- Add budgets, forecasts, and alerts for unusual changes.
- Connect spending with the delivery or business outcomes it is meant to improve.
- Set clear actions for investments that should expand, change, or stop.
Finance, engineering, procurement, and business leaders should agree on the definitions before the report reaches the board. Otherwise, the meeting can turn into an argument about what the numbers include instead of a decision about what to do next.
Frequently Asked Questions
Does the board need to see token counts?
Usually not as a headline measure. Token counts can help explain usage and cost changes, but they need context. The board is more likely to care about total spend, budget risk, ownership, and value.
How often should we report AI token spending?
Track spending continuously and review it with budget owners at least monthly. A quarterly board update may be enough when spending is stable. Material overages, unexplained spikes, or major investment decisions should be raised sooner.
What if our AI spending is spread across many tools?
Use a consolidation and attribution layer above the individual vendor dashboards. Normalize the cost and usage data, then map it to the teams, agents, projects, and use cases that generated it.
Does the Tokenomics Foundation create new reporting rules?
Not yet. The foundation has launched a roadmap for open standards, benchmarks, and best practices. Its work may shape future reporting, but organizations still need to define and govern their own AI cost measures today.
What if we can’t connect spending to business outcomes yet?
Start with total spend, ownership, budget trend, and the clearest available operational measures. Then improve the value side as the measurement system matures. Reporting an honest gap is better than presenting a precise ROI number that the data cannot support.
Build the Board-Ready AI Cost View Before the Meeting
Larridin consolidates AI spending across tools and agents, maps it to teams and use cases, flags budget risks, and connects the cost with business and engineering outcomes.
Book a discovery call to build an AI token cost view that can stand up in a board meeting.