


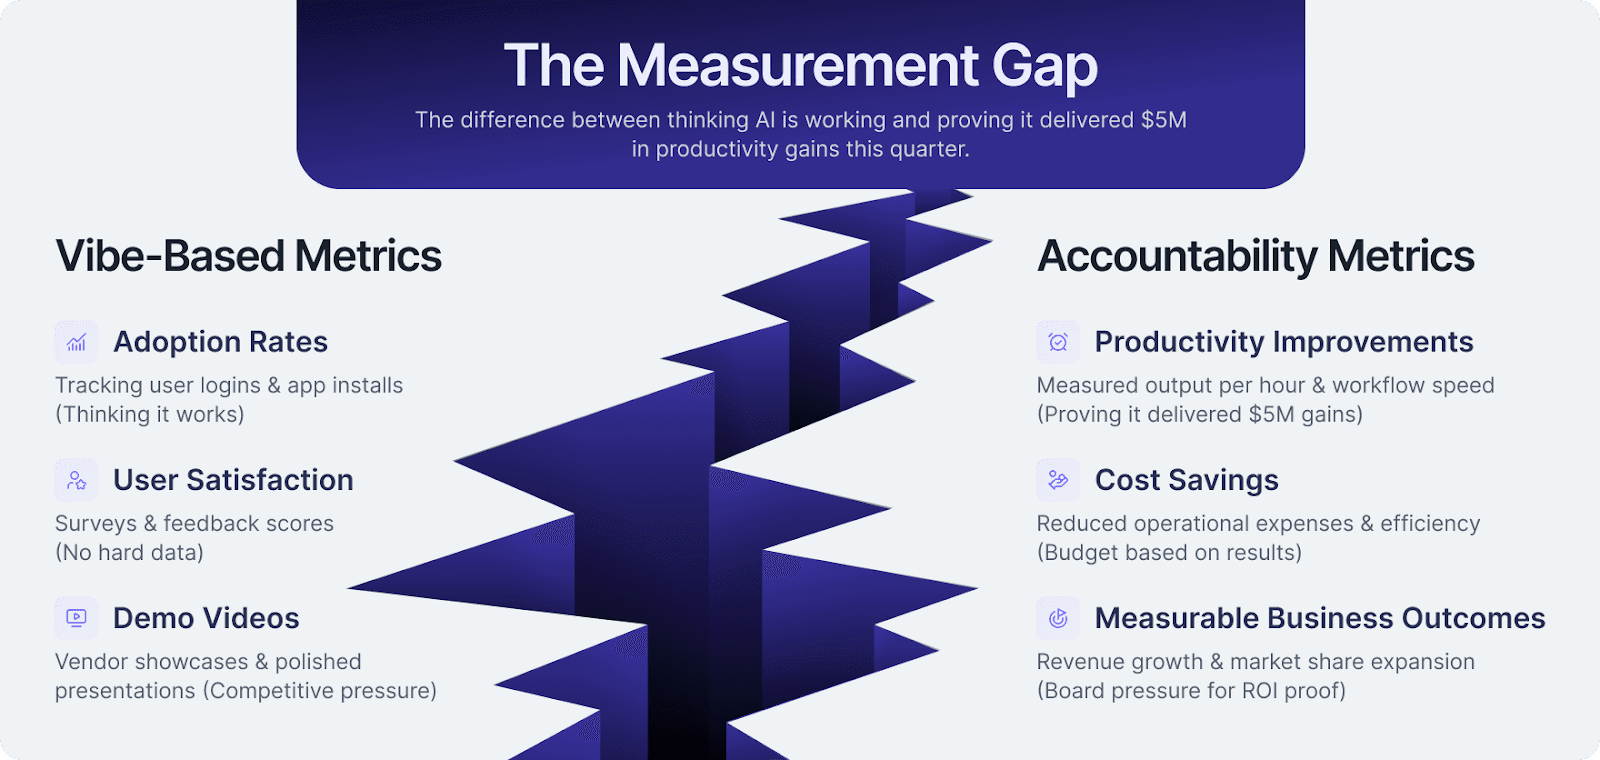
The board asks what the organization received for its AI investment. Adoption, satisfaction, and demonstrations provide context, but financial ROI requires a defined cost scope, attributable benefits, a comparison baseline, and evidence that the benefit was realized.
Key Takeaway
Move from vibe-based spending to a decision process that connects utilization, proficiency, workflow outcomes, and full cost. Build on existing TBM and FinOps discipline, evaluate the rollout trajectory with explicit checkpoints, and use scenarios until measured data can replace assumptions. An ROI model should change when its evidence changes.
Key Terms
- AI ROI: Net attributable financial benefit relative to the defined investment cost over a stated period.
- Vibe-based spending: Investment justified primarily by demonstrations, enthusiasm, or competitive pressure rather than measured results.
- Released capacity: Time or effort made available for other work, distinct from realized cash savings.
- Recapture: The portion of released capacity assumed or observed to become useful value.
- Unit economics: Cost or resource consumption per consistently defined accepted outcome.
- Baseline: A comparison record of the relevant workflow, quality, effort, and costs.
Why Adoption Claims Do Not Answer the ROI Question
Licenses establish access. Active users establish participation. More prompts or generated artifacts can reflect useful work, experimentation, retries, or additional correction. None independently establishes financial benefit.
Vendor studies and broader research can motivate questions, but they do not prove a result in your environment. Compare your workflow, work mix, quality, review effort, and costs with a relevant baseline, and document what remains uncertain.
The Five Measurement Risks
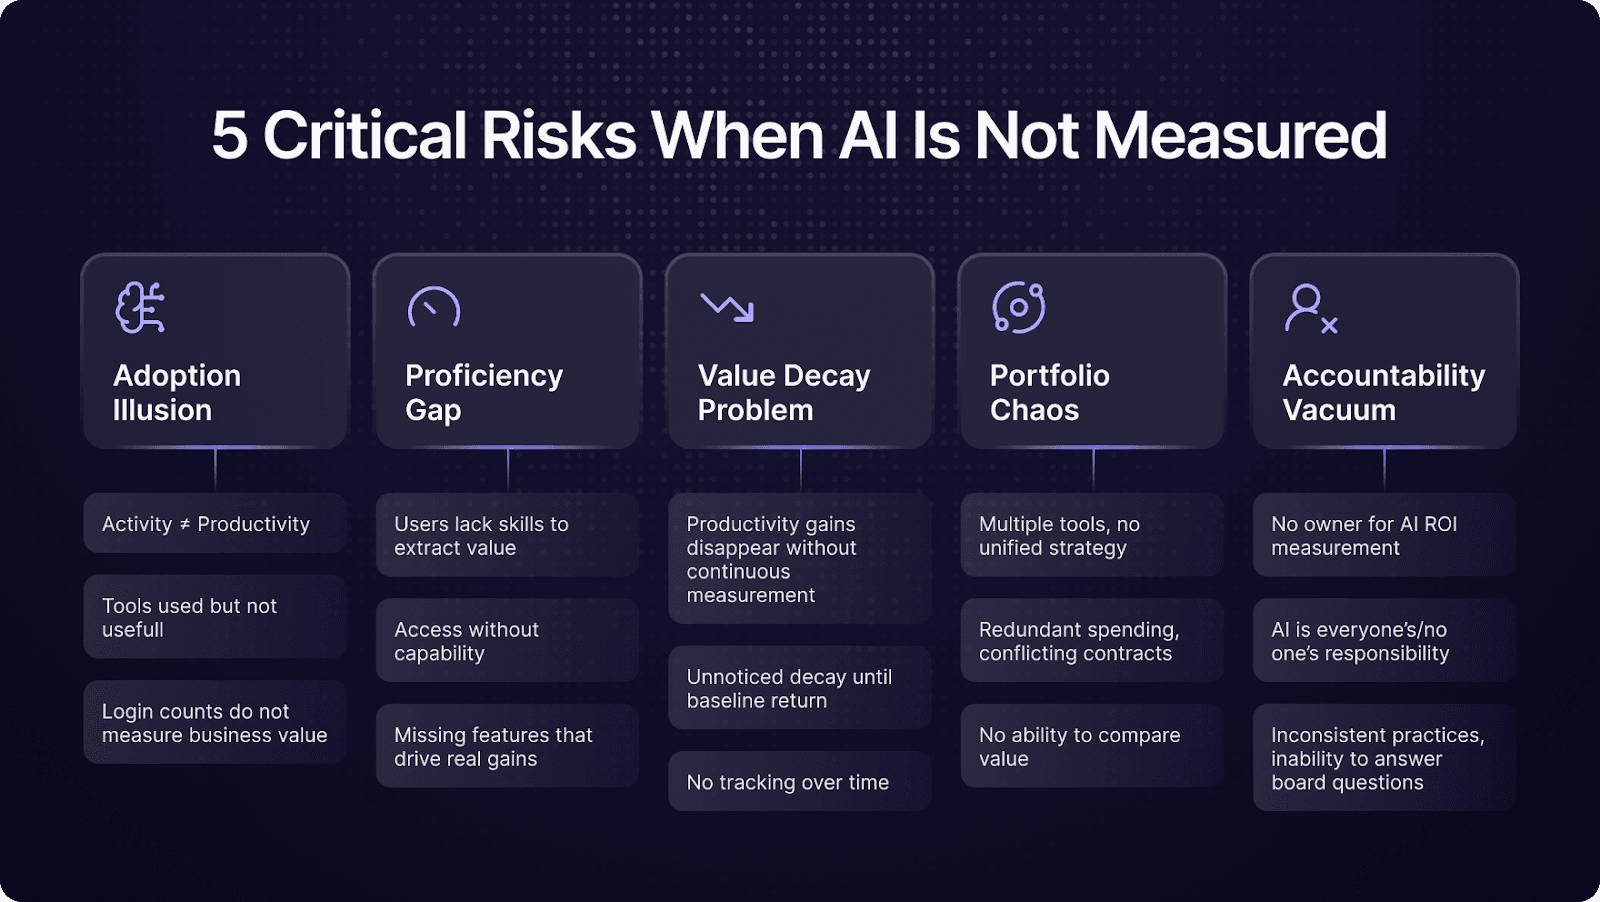
- Adoption illusion: Activity becomes the goal while accepted outcomes remain unknown.
- Proficiency gap: Access exists without effective scoping, context, verification, or workflow integration.
- Value decay: Initial gains weaken as practices, tools, data, or integrations change.
- Portfolio fragmentation: Costs and benefits across tools use incompatible definitions or count shared work repeatedly.
- Accountability vacuum: No one owns the benefit assumptions, cost reconciliation, review, and next decision.
These are diagnostic risks, not proof that every AI investment fails. Assign owners and controls appropriate to the use case instead of treating a larger dashboard as the remedy.
Build on TBM and FinOps, Not Instead of Them
The TBM and AI ROI comparison clarifies their roles. Technology Business Management supplies a cost taxonomy and common financial language. FinOps manages variable, consumption-based technology spending and supports unit economics and value decisions. Neither should be dismissed as a pre-cloud model incapable of AI costs.
The additional measurement question is whether the cost produced an accepted business result and how effective human and agent practices contributed. Cost reporting alone cannot supply that proof, although connected financial-management products may add outcome tracking.
Reuse cost pools, allocations, commitments, and reconciled invoices. Add tool discovery where approved application catalogs miss activity, reliable user and agent attribution, workflow and proficiency context, and outcome evidence.
Verify current product coverage rather than assume every TBM or FinOps platform has the same boundaries. A combined approach can preserve financial rigor without replacing a system that already meets the cost-management need.
Build the ROI Measurement Framework
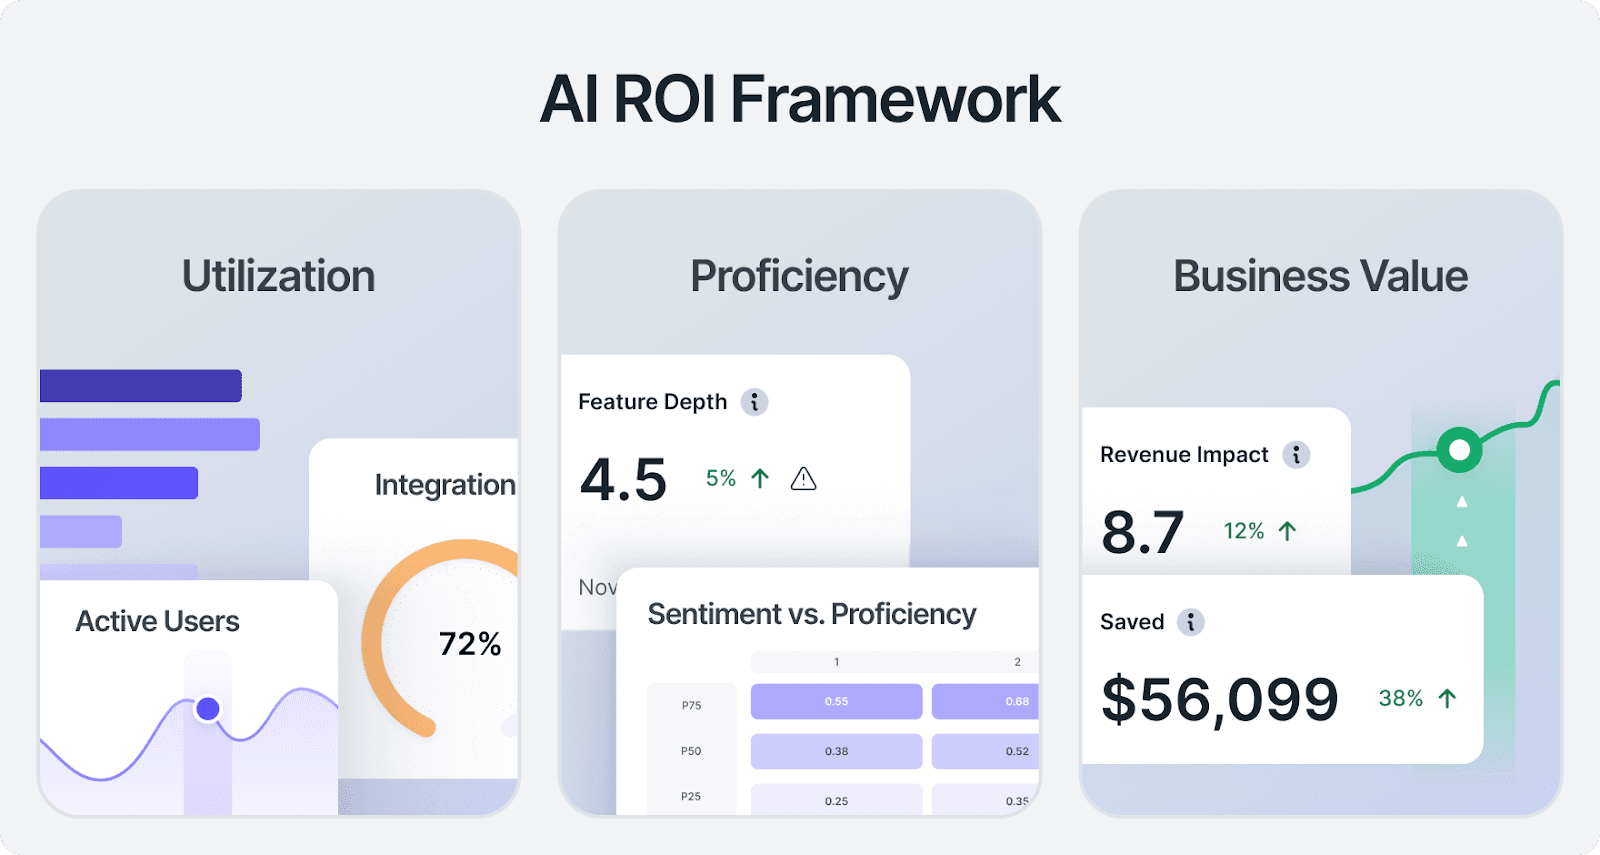
1. Measure Utilization
Record eligible users, assigned access, active use, retention, relevant features, and workflow participation. Define periods and qualifying behavior. Separate human activity from autonomous runs, and avoid double counting people using several tools.
2. Assess Effective Practice
Examine task fit, context grounding, steering, verification, and repeatable workflow integration. Use behavioral indicators, approved practical evidence, and outcomes with appropriate privacy safeguards. Surveys explain confidence and barriers but are not demonstrated skill.
High use with weak results can reflect data, integration, governance, or workflow problems as well as skill. Diagnose before choosing more training, licenses, or a different tool.
3. Measure Accepted Outcomes
Choose the result the investment should change: resolution quality, cycle time, durable engineering output, error rate, contribution margin, or another business measure. Include human review, exceptions, rework, and downstream effort.
Department-specific outcomes should share financial definitions, not a universal activity count. Marketing drafts, support resolutions, and engineering changes are not directly comparable units.
4. Establish the Comparison
Capture pre-deployment records where possible. Use matched tasks, teams, or a phased rollout when practical. Account for staffing, complexity, demand, seasonality, policy, and other process changes. Before-and-after movement alone does not establish causation.
If history is missing, use the earliest reliable evidence and establish a current baseline. Disclose the limit rather than claim an exact historical return or abandon future measurement.
5. Count Full Cost and Validate Benefits
Include relevant licenses, consumption, infrastructure, implementation, integrations, training, governance, review, recovery, remediation, and maintenance. Separate rollout from recurring cost, actual charges from labor estimates, and shared allocations from direct attribution.
Value released time only under a documented method. Confirm whether it reduced outside spend or overtime, enabled additional useful work, or produced another accepted benefit. Gross revenue is not automatically incremental profit, and the same improvement should not appear in several benefit categories.
Calculate Net ROI With Explicit Scope
Net ROI = (attributable monetized benefits − defined costs) ÷ defined costs. Multiply by 100 for a percentage. Benefits divided by cost is a benefit-cost ratio, not net ROI.
An estimate of hours saved times a loaded labor rate is a capacity-value estimate, not automatic payroll savings. Apply a justified realization or recapture assumption, label it, and replace it with observed benefit evidence where possible.
State the period, populations, benefit method, cost categories, shared-work treatment, quality guardrails, and uncertainty. A positive ratio built from unverified assumptions is a planning scenario rather than measured financial return.
An Illustrative 5,000-Person Enterprise Model
The 5,000-person enterprise model demonstrates scenario construction. Every figure below is illustrative, not a benchmark or customer result.
The source assumes a phased rollout targeting 3,000 active users by month 12, with different average active populations over the year. It uses a $35 monthly blended seat rate, $250,000 implementation, and $180,000 enablement. Its licensing simplification uses average active users as the charged population; a real model must instead use actual contracted or assigned seats, minimums, and commitments.
The value assumption is eight hours saved monthly for a typical user and 20 for a power user, a $60 hourly labor-value rate, and scenario-specific recapture. These are point assumptions, not exhaustive empirical workforce segments.
| Scenario | Average Active Users | Power-User Share | Recapture | Year 1 Cost | Estimated Value | Net ROI, Rounded |
|---|---|---|---|---|---|---|
| Lower case | 1,200 | 4% | 35% | $934,000 | $2,564,352 | 1.7× |
| Base case | 1,750 | 6% | 50% | $1,165,000 | $5,493,600 | 3.7× |
| Higher case | 2,400 | 10% | 65% | $1,438,000 | $10,333,440 | 6.2× |
Source: Larridin's illustrative model, published September 3, 2026. The scenario labels describe the modeled cases, not the full range of possible results; an actual rollout can underperform all three.
Estimated value = [(typical users × eight monthly hours) + (power users × 20 monthly hours)] × $60 × 12 × recapture. The net ratios are based on that capacity valuation, not confirmed cash savings.
The source's cost scope omits separately itemized consumption and some ongoing operating costs. Add those where relevant, along with review and rework, before adopting it for a live budget. Update assumptions throughout rollout and broaden the assessment beyond time estimates to quality and business outcomes.
Manage the J-Curve With Checkpoints
The AI coding J-curve guide explains why cost starts before gains may appear. Learning, integrations, security, new review practices, and workflow changes can add early effort. Not every rollout dips, and not every dip recovers.
- Before rollout: Define the baseline, success criteria, budget boundaries, quality, and expected evidence window.
- At an agreed checkpoint: Review actual spend, sustained use, delivery, review burden, quality, and the constraint. A 90-day review can be useful but is not a universal payoff date.
- At the expected breakeven window: Compare full cost and attributable benefits, assess durable outcomes, and choose expansion, correction, extension, or closure.
Benchmark ranges are planning context, not guaranteed schedules. A team missing its checkpoint needs a cause, corrective action, and next decision date. “J-curves take time” is not sufficient justification for indefinite weak performance.
Use the Framework at Budget Review
The tool ROI budget-review guide applies the framework to renewal. Read utilization, proficiency, outcomes, and full cost together:
- Strong use and dependable outcomes: Consider retention or bounded expansion with an incremental cost case.
- High use and weak outcomes: Investigate fit, practice, quality, and workflow constraints before renew or cut.
- Low use across intended workflows: Check access, onboarding, reporting, task need, and alternatives.
- Low overall use with concentrated value: A specialist tool may deserve retention if the evidence supports it.
- Overlapping capabilities: Compare equivalent work, governance, integrations, transition costs, and lost functionality before consolidation.
Vendor case studies and standardized benchmarks are context, not proof of the internal result. Budget decisions should preserve useful capability while exposing where the evidence or economics no longer support the investment.
Maintain the Record and Decision Cadence
Monitor material costs, agent exceptions, quality, and activity operationally. Review capability and workflow findings with the owners, and bring validated financial scope and outcomes to investment decisions. Cadence should follow risk and outcome latency rather than a rigid calendar.
Keep definitions and source histories stable enough for comparison. Record scoring, model, population, and coverage changes. Missing events or a failed connector are not zero usage.
Common Mistakes
- Reporting access, logins, or output volume as financial value.
- Multiplying all saved time by compensation and calling it realized savings.
- Excluding token consumption, human verification, or failed work from costs.
- Counting a joint outcome in full under every contributing tool.
- Replacing financial-management rigor instead of complementing it.
- Using a favorable model scenario as a measured result.
- Excusing weak results indefinitely as a J-curve.
- Comparing unlike workloads or claiming causation from correlation.
- Assuming measurement infrastructure guarantees a positive return on its own.
Mature the Measurement Capability
Progress from ad hoc questions to documented definitions and ownership, then integrated data and repeated decision support. Forecasting and scenario analysis add value when validated against actuals. Predictive models are estimates, not certainty about future ROI.
Assess the measurement system itself through coverage, reconciliation, allocation gaps, definition consistency, forecast performance, decision follow-through, and the cost of maintaining the record. Continued funding is not independently proof that an initiative creates value.
Frequently Asked Questions
How is AI ROI different from adoption?
Adoption measures participation. ROI compares attributable monetized benefits with defined costs. Proficiency, quality, workflow results, and appropriate comparisons help establish the benefit case.
Can TBM or FinOps support AI ROI?
Yes. They provide useful cost and allocation discipline and may connect with outcome tools. Verify coverage and add the missing proficiency, agent, workflow, and business evidence rather than assume financial frameworks are obsolete.
Does early weak performance mean the rollout should stop?
Not automatically. Diagnose learning, integration, fit, review, and rework against the baseline. Continue only with a credible plan and checkpoint; an early dip does not guarantee later gains.
Can a spreadsheet start the assessment?
Yes, for a bounded use case with reliable records and definitions. It can organize evidence and assumptions. Tracking estimated hours alone does not prove financial return.
Should tools with low usage be cut?
Not automatically. Examine concentrated value, task need, access barriers, quality, costs, and contract terms. Use activity to start the investigation, not end it.
How accurate should a pre-launch model be?
It should reveal assumptions and sensitivity rather than appear exact. Use several plausible cases, include material costs, and replace estimates with actual evidence as the rollout progresses.
How should results roll up across departments?
Keep workflow-specific outcomes and consistent financial methods. Reconcile shared costs and benefits, separate capacity from cash, and preserve uncertainty rather than monetize everything into one unsupported total.
Build an Accountable ROI Record
Larridin connects adoption, proficiency-related signals, spending, workflows, and outcomes. Confirm integration coverage and methods for the investment being assessed.
Talk to our team about your AI ROI measurement needs.
Define the benefit. Count the cost. Verify the comparison. Replace assumptions as the evidence arrives, and make the next investment follow the result.