

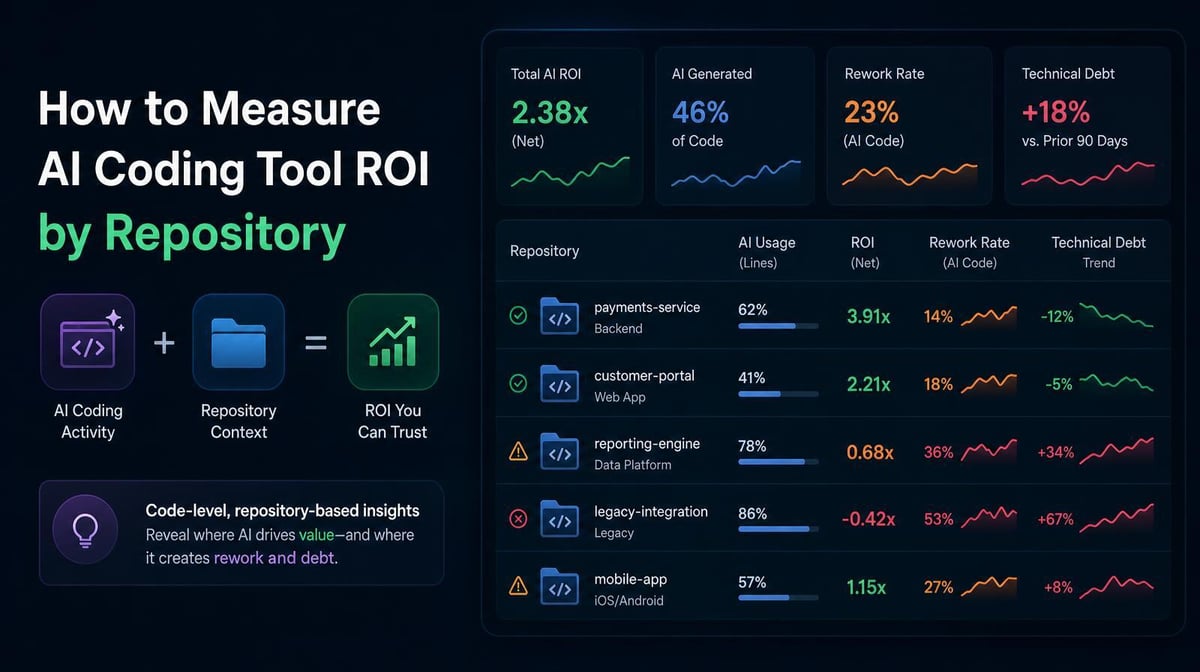

A positive team-wide AI ROI number can still hide a problem. One repository may be shipping faster with durable code, while another absorbs more review, rework, and token spend. Repository-level measurement shows where AI creates value and where it adds work and cost.
Key Takeaways
- The same AI tool can produce strong ROI in one repository and weak ROI in another. Test quality, documentation, CI speed, and architecture help explain the difference.
- Measure AI coding tool ROI by repository across four connected areas: AI contribution, delivery improvement, code durability and quality, and total cost.
- Compare each repository with its own pre-AI baseline first. Cross-repository comparisons are most useful when the codebases have similar risk, complexity, and business purpose.
Why Team Averages Hide Repository-Level Results
A team may use the same AI coding tools across several repositories, but the tools aren’t working in the same environment.
A well-documented service with fast tests and clear ownership gives an agent useful context and quick feedback. A legacy system with flaky tests, unclear boundaries, and slow CI creates more chances for retries, review delays, and rework. The developers and licenses may be the same, but the operating conditions are not.
DORA’s 2025 research describes AI as an amplifier: it magnifies the strengths of high-performing organizations and the dysfunctions of struggling ones. In a separate DORA report on generative AI, a 25% increase in AI adoption was associated with a 1.5% decrease in delivery throughput and a 7.2% decrease in delivery stability. The finding doesn’t mean that AI always hurts delivery. It shows why more use or faster code generation cannot stand in for measured outcomes.
Larridin’s AI-Native Developer Intelligence framework applies that idea at the codebase level. Agents perform better when repositories are easy to understand, test, and change safely. Repository-level measurement makes those differences visible before a team average turns them into one blended result.
4 Measures to Track AI Coding ROI by Repository
No single metric can identify the highest-ROI repository. Use the same scorecard for every codebase and read the measures together.
1. AI Contribution
Start by measuring how much AI-assisted work enters each repository.
Useful measures include:
- AI-assisted lines as a percentage of committed code
- AI-assisted commits
- AI-assisted pull requests
AI code share is a composition metric. It shows how much of the committed code AI helped produce. It doesn’t show whether that code was useful, durable, or worth the cost.
That distinction matters because two repositories can have the same AI code share and very different results. One may have high AI contribution, faster delivery, and stable quality. Another may have the same contribution but longer reviews and rising turnover. The percentage provides context for the outcome measures that follow.
2. Delivery Improvement
Next, compare delivery before and after AI adoption in the same repository.
Look at measures such as:
- Complexity-adjusted throughput
- Lead time for changes
- Pull request cycle time and review time
- Deployment frequency
- Accepted work completed
Raw volume can be misleading when AI generates more code and more small pull requests. Larridin’s Developer Productivity Benchmarks recommend comparing AI code share with complexity-adjusted velocity and quality data rather than treating output volume as value.
3. Code Durability and Quality
Delivery gains only count when the work holds up.
Track quality by repository and separate AI-assisted changes from human-only changes, if possible. Useful measures include:
- 30- and 90-day code turnover
- Revert rate
- Rework hours
- Change failure rate
- Incidents, hotfixes, and rollbacks
- Review pushback or repeated revision
Larridin defines code turnover as code that is reverted, deleted, or substantially rewritten within a set period after merge. Breaking it down by repository or service helps identify which systems are absorbing the most rework.
Read the pattern carefully. Rising AI code share alongside rising turnover or change failure rate is a reason to investigate, not proof that AI caused the decline. The repository may also have changed project type, release pressure, staffing, or requirements. Segmenting the data gives leaders a place to ask the next question instead of jumping to the wrong answer.
4. Total Cost
The final layer is what the AI-assisted work cost in that repository.
Include:
- Allocated licenses and subscriptions
- Token and API spend
- Agent or premium-model charges
- Implementation and integration time
- Review and verification time
- Rework and incident costs
Repository attribution shows where the spending occurred. It becomes ROI measurement only when that cost is connected to delivery and quality outcomes.
A practical measure is cost per accepted, durable outcome. The outcome might be a completed feature, a complexity-adjusted unit of work, or a pull request that merged and survived the chosen quality window. The exact unit can vary, but it should represent useful work, not just activity.
Larridin’s AI coding cost attribution guidance recommends looking at repository spend alongside throughput, lead time, deployment frequency, change failure rate, incidents, rework, and code turnover. That prevents leaders from treating high spend as automatically bad or low spend as automatically efficient.
How to Compare Repository ROI Without Creating a Bad Leaderboard
Repository-level data can be misleading when leaders rank codebases without context. A mature payments system, an internal tool, and a new product service shouldn’t be expected to produce the same AI code share, delivery speed, or failure profile.
Use this process instead.
1. Establish a Baseline for Each Repository
Record delivery, quality, and cost before rollout or use the earliest reliable period available. Compare the repository with its own prior performance before comparing it with another codebase.
2. Group Similar Repositories
Create useful comparison groups based on factors such as:
- Greenfield versus legacy work
- Customer-facing versus internal systems
- Risk and compliance requirements
- Test coverage and CI maturity
- Architecture and language
- Feature, maintenance, infrastructure, or platform work
This keeps a high-risk legacy system from looking inefficient simply because it needs more review than a low-risk internal application.
3. Read the Measures as a System
A strong repository-level result typically shows:
- AI contribution is clearly measured
- Complexity-adjusted delivery improves
- Review and lead time do not absorb the gain
- Turnover, failure, and incident measures stay stable or improve
- Cost per accepted, durable outcome improves over time
A repository warrants investigation when AI contribution or spending rises while delivery stays flat, review slows, or quality weakens.
4. Diagnose Before Changing Access
Start by identifying the constraint. A weak result may point to poor task selection, missing repository context, flaky tests, slow CI, oversized changes, insufficient review, or use of expensive agents on low-value work.
The fix may be better documentation, smaller tasks, stronger tests, different model routing, or tighter review rules. Cutting licenses across the team can hide the repository problem without solving it.
Frequently Asked Questions
Why are team-level AI ROI metrics misleading?
They combine results from repositories with different codebase conditions, work types, risk levels, and quality controls. The average may be accurate, but it can’t show where gains or costs are concentrated.
What AI code share should trigger closer monitoring?
There’s no universal cutoff. Larridin’s benchmarks place average AI-assisted line share at 15% to 25% and top-quartile teams at 40% to 60%, but the right level depends on the repository and its quality results. Rising AI code share paired with more turnover, failures, or rework is more useful than a percentage alone.
Can the same AI tool produce positive ROI in one repository and weak ROI in another?
Yes. Repository readiness, task type, documentation, test quality, architecture, and review processes all affect whether AI-assisted work becomes durable output. That’s why the same license and team can produce different results across codebases.
How do we tell whether AI caused a quality change?
Compare AI-assisted and human-only changes within the same repository and time window. Control for change type, size, complexity, and risk where possible. Rising AI code share alongside more turnover, failures, or rework is a stronger signal than the percentage alone.
See Which Repositories Are Turning AI Into Durable Value
Larridin connects AI contribution, delivery, quality, and cost data so engineering leaders can see where AI-assisted work is producing durable returns and where the system needs attention.
Book a discovery call to see AI coding ROI across your repositories.