

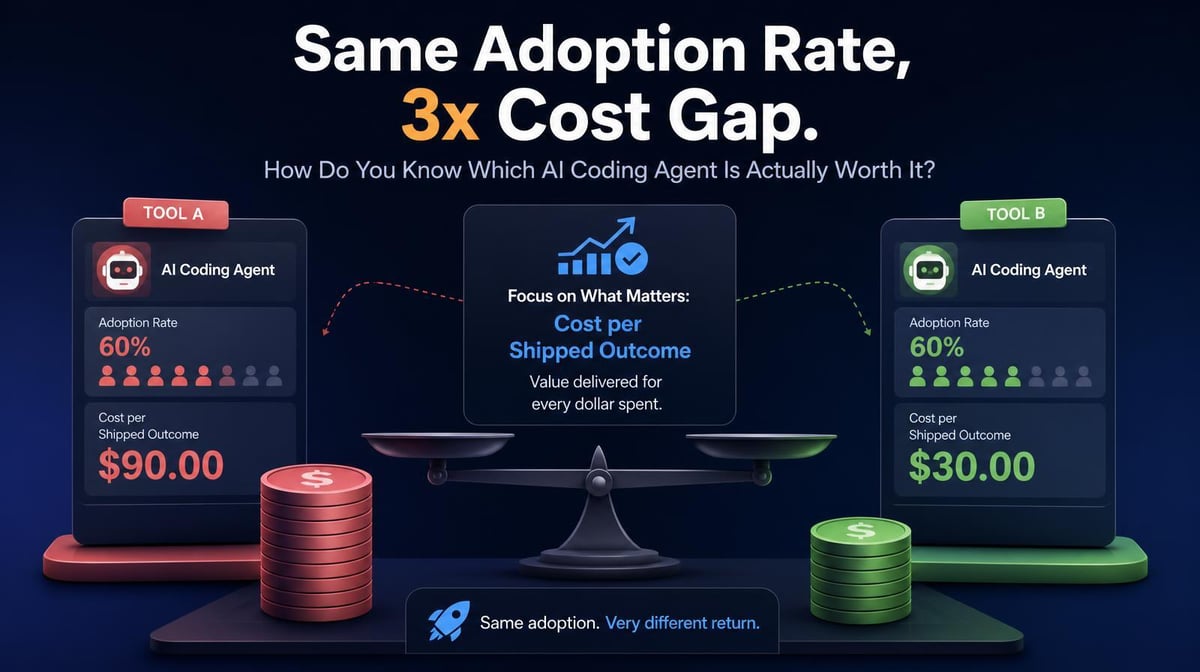

Adoption rate tells you how many engineers used a tool. It doesn’t tell you whether the tool delivered enough value for the cost. Cost per shipped outcome adds that missing piece.
Key Takeaways
- Identical adoption rates can mask very different usage and cost-efficiency patterns.
- Cost per shipped outcome connects AI spend to accepted delivery, giving leaders a stronger decision signal than seats or session counts alone.
- A large cost gap is a reason to investigate task mix, quality, and outcomes before expanding, rationalizing, or standardizing AI coding tools.
Why Adoption Rate Isn’t Enough for Tool Decisions
In one Larridin customer environment, Codex and Claude Code both reached 91% weekly active adoption, with 10 of 11 engineers using each tool. But usage wasn’t identical: Claude Code averaged 191.3 sessions per week compared with 168.3 for Codex.
Cost per shipped outcome showed an even larger difference. Codex cost $10.97 per outcome, while Claude Code cost $29.62 — a 2.7x gap. In this customer data, a shipped outcome was a session that produced a merged PR.
Adoption only tells engineering leaders whether a tool has reached the team and whether engineers are actually using it. But once multiple tools reach similar adoption levels, the next question is what that usage produces for the money being spent.
That’s the comparison Larridin’s Agent Effectiveness is designed to surface: cost per shipped outcome by tool rather than adoption alone.
Why Agent Effectiveness and Outcome Success Need to Be Read Separately
The same customer environment had an Agent Effectiveness Score of 90 and an organization-level Outcome Success rate of 10%.
In this environment, Outcome Success was defined as the share of sessions that ended in a merged PR. Agent Effectiveness is a broader Larridin score, so the two numbers shouldn’t be treated as interchangeable measures of performance.
Read together, the two measures show where engineering leaders should investigate next. A strong Agent Effectiveness Score can coexist with only 10% of sessions reaching the defined shipped outcome. That gives engineering leaders a reason to investigate task selection, workflow design, tool fit, and how teams are using agents.
What Cost Per Shipped Outcome Actually Tells You
Cost per shipped outcome connects the cost of an AI coding tool to the result it produced. In this customer environment, it was calculated as tool spend divided by sessions that produced a merged PR.
That makes the $10.97 versus $29.62 comparison useful. The tools had the same adoption rate, but one required substantially more spend per shipped outcome in the observed usage pattern.
The 2.7x gap doesn’t automatically mean that Codex is better or Claude Code should be cut. It creates a more specific procurement question: why is there a difference?
Engineering leaders can then look at whether the tools are being used for comparable work, whether one is handling more complex tasks, whether quality differs, and whether the higher-cost tool is producing value that the aggregate cost-per-outcome number does not capture.
That’s a much stronger basis for tool decisions than comparing seats, weekly active users, or session counts in isolation.
How to Use the Data in Tool Rationalization Decisions
A cost-per-outcome comparison is most useful as the start of a decision process, not the end of one.
- Find the meaningful gaps. Compare adoption, usage, and cost per shipped outcome by tool. Large differences show where deeper analysis is worth the time.
- Check the context behind the number. Compare the task mix and outcomes associated with each tool. A higher cost per shipped outcome may be justified if the tool is being used for harder or higher-value work.
- Make a targeted investment decision. Expand, rationalize, or change how a tool is used only after the cost gap has been evaluated alongside the work and outcomes behind it.
Larridin’s Developer Productivity Benchmarks 2026 provides additional context for evaluating AI-assisted engineering performance without reducing the decision to a single metric.
Frequently Asked Questions
How is cost per shipped outcome calculated?
For this customer analysis, cost per shipped outcome was total spend for a tool divided by the number of sessions that produced a merged PR.
The useful outcome can vary by organization or workflow, but the principle is the same: connect AI spend to a defined delivery result rather than comparing cost or usage in isolation.
What does a 10% Outcome Success rate tell us?
In this customer environment, Outcome Success was measured at the organization level and defined as the share of sessions that ended in a merged PR. A 10% rate means one in 10 sessions reached that defined outcome.
It does not tell us why the other sessions did not produce a merged PR or whether they were failed, exploratory, or useful in another way. The rate is a signal to investigate the gap, not a complete diagnosis.
Should we switch entirely to Codex if it has a better cost per shipped outcome?
Not from this comparison alone.
The $10.97 versus $29.62 result reflects how the tools were being used in this specific environment during the measurement period. Before standardizing on one tool, compare the kinds of work each handled and the quality and value of the resulting outcomes.
How do we improve Outcome Success?
Start by examining the sessions that did and did not reach the defined shipped outcome. Compare task type, tool, cost, and delivery result to identify patterns.
The goal is to determine whether the gap is primarily a tool-fit problem, a task-selection problem, or a workflow problem before changing the rollout or setting a target.
See Cost Per Shipped Outcome by Tool, Not Just Adoption Rate
Larridin’s Agent Effectiveness view shows cost per shipped outcome by tool, helping engineering leaders see when similar adoption rates are producing very different economics.
Book a discovery call to compare AI coding tool cost and outcomes across your engineering organization.