
Enterprise AI Measurement Guide
Survey Data
Survey Summary
What does the Survey summary card show for each engineering survey in the Survey Data tab?
What it shows
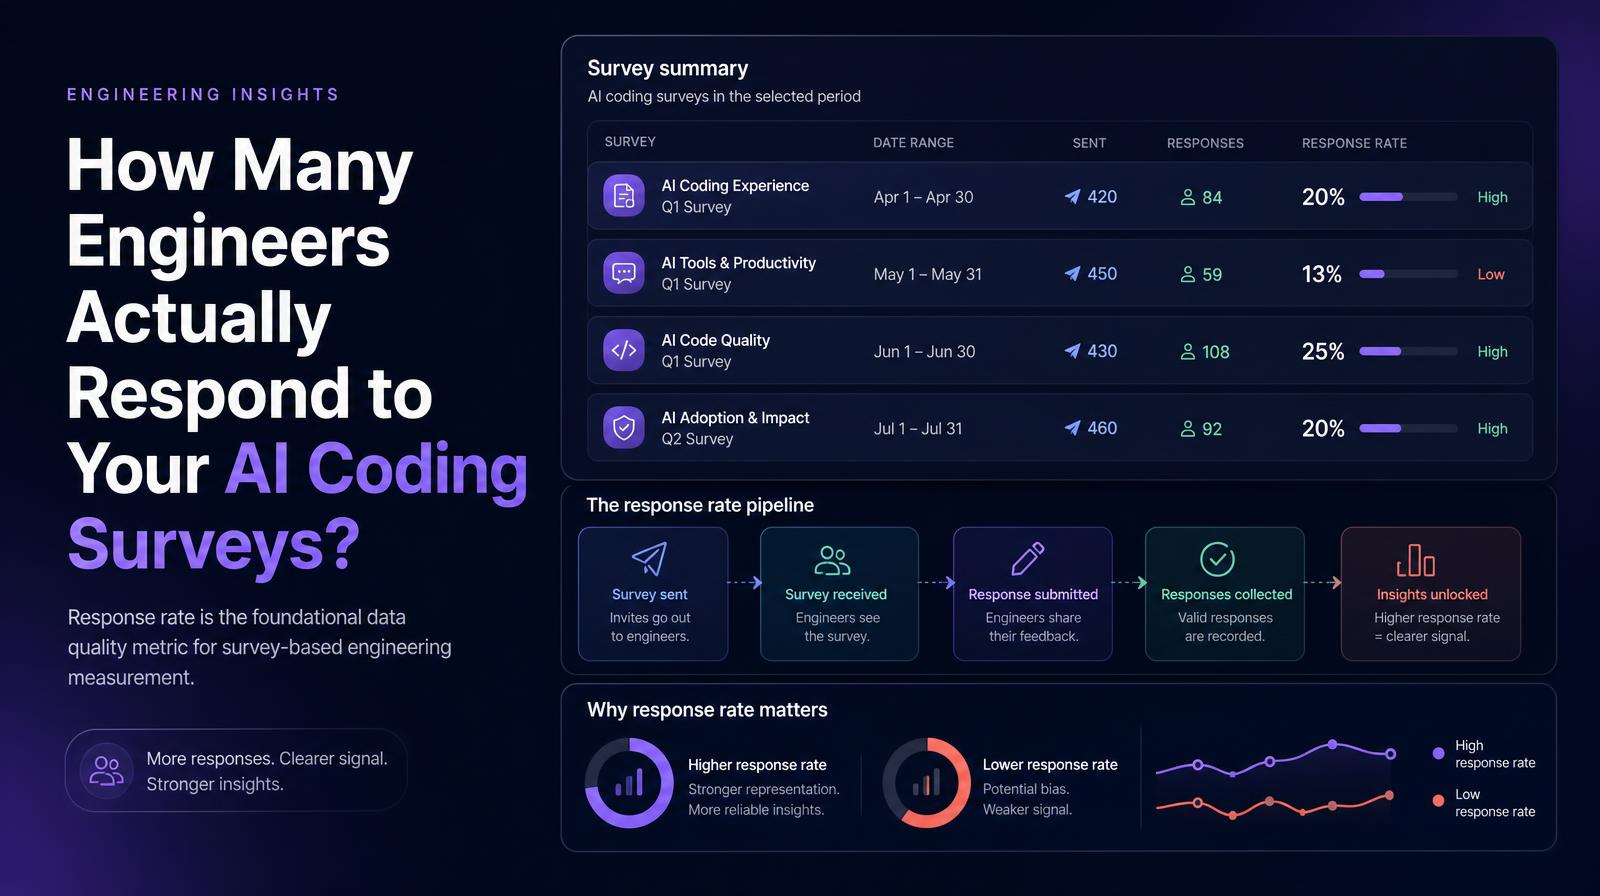
The Survey summary card shows the metadata for each engineering survey in the selected period, its name, the dates it covered, how many surveys were sent, and how many responses were received. Response rate is the foundational data quality metric for survey-based engineering measurement: a survey with a 15% response rate tells a different story about team sentiment than one with an 80% response rate, even if the average scores look similar.
Why it matters
Survey data without response rate context is unreliable as a management input. Low response rates introduce selection bias, engineers who choose to respond are often systematically different from those who don't, skewing results toward either the most engaged or the most frustrated. CHROs and CTOs using engineering survey data to make decisions about AI tool investment, training programs, or workflow changes need the response rate to calibrate how much weight to put on the findings.
The Larridin angle
Larridin surfaces survey response rate alongside the results themselves, not as a footnote, but as a primary display metric, because response rate determines the confidence interval of every finding that follows. The survey summary is also the entry point into the per-respondent breakdown in the Survey Results table, making it possible to cross-reference high-response-rate periods against low-response-rate ones when interpreting trend data.
Related Survey Data Metrics
Common questions
What information does the Survey Summary card provide?
The Survey Summary card provides metadata for each engineering survey, including the survey name, the period it covered, the number of surveys sent, and the number of responses received.
Why is the response rate important for engineering surveys?
The response rate is crucial because it determines the reliability of the survey data; low response rates can introduce selection bias, affecting the accuracy of the insights drawn from the survey.
How does Larridin present survey response rates?
Larridin prominently displays survey response rates alongside the results to emphasize their importance in interpreting the confidence interval of the findings.
How can low response rates affect decision-making for AI investments?
Low response rates can skew survey results, leading to potentially unreliable data that might misinform decisions about AI tool investments, training programs, or workflow changes.