
Enterprise AI Measurement Guide
Quality
Quality Metric Tabs
Which code quality metrics are available in the Larridin Quality tab, and what do each of the sixteen metric views cover?
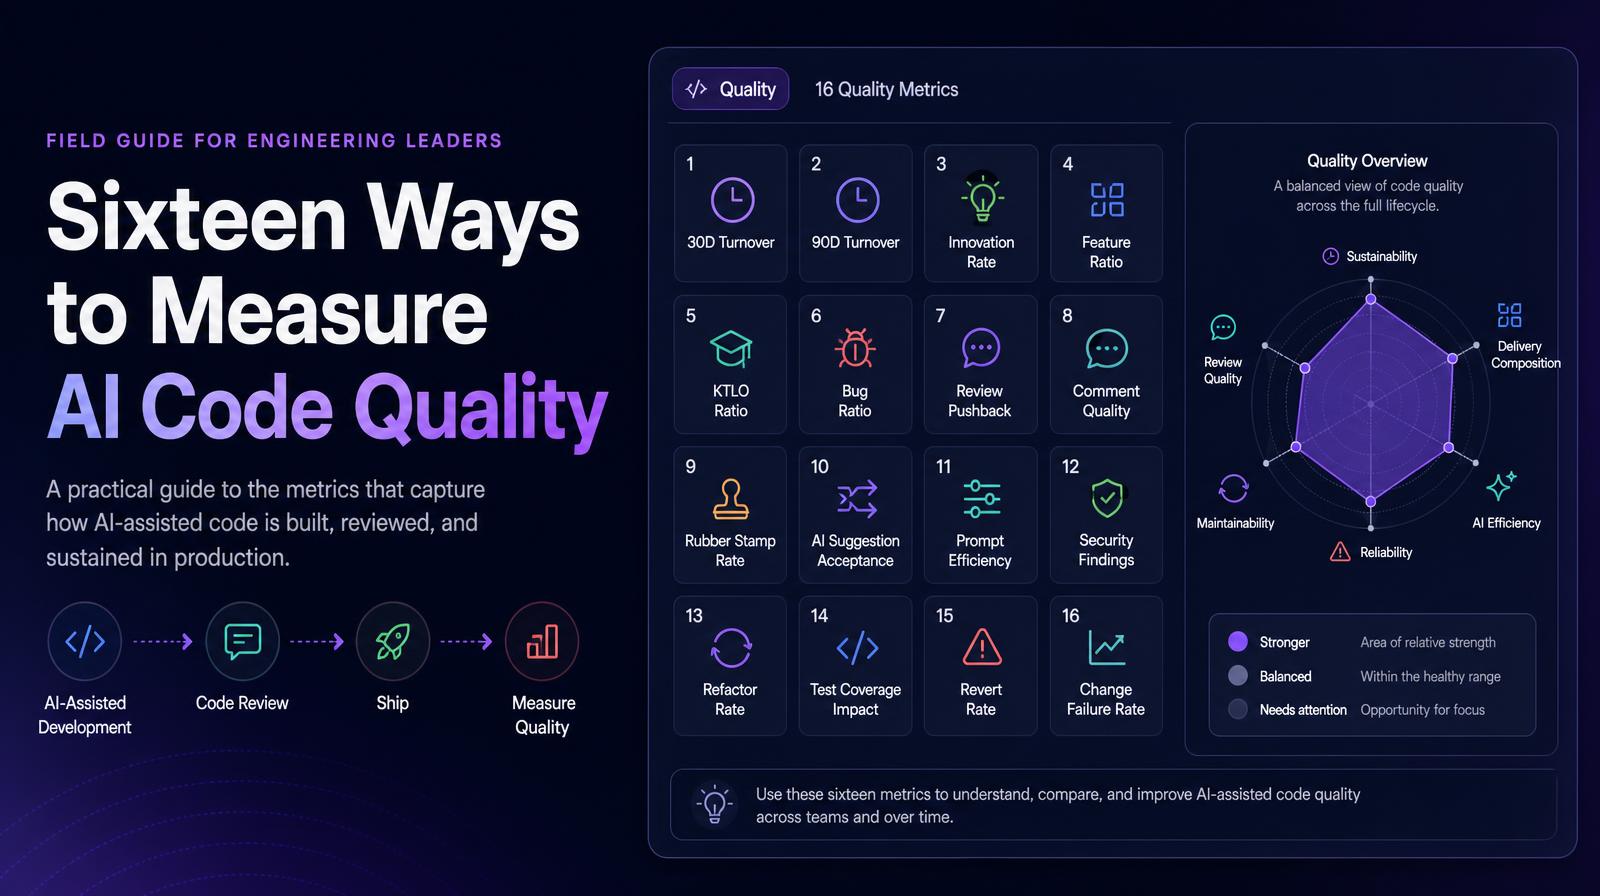
What it shows
The Quality tab surface sixteen distinct code quality metrics, each as a selectable view, covering the full spectrum of what "quality" means in AI-assisted engineering: how long code survives (30D/90D Turnover), what kind of work it represents (Innovation Rate, Feature/KTLO/Bug ratios), how well it was reviewed (Review Pushback, Comment Quality, Rubber Stamp Rate), how AI was involved in review and authorship (AI Code Share, AI vs Human Review, AI Slop Index), and whether it was tested (Unit Tests). No other engineering dashboard combines these sixteen dimensions in a single tab.
Why it matters
AI coding adoption creates pressure on almost every one of these sixteen metrics simultaneously, code turnover rises when AI generates code that doesn't survive review, rubber stamp rates rise when review queues grow faster than reviewer capacity, and the AI Slop Index surfaces the specific pattern of AI-generated code that passes review but degrades the codebase over time. CTOs managing AI-assisted engineering teams need visibility across all sixteen, not just the two or three that traditional DORA dashboards cover.
The Larridin angle
Larridin's Quality tab is the most comprehensive code quality measurement surface available for AI-assisted engineering teams. The AI Slop Index, Larridin's proprietary signal for AI-generated code that is syntactically correct but semantically poor, is unique to the platform and directly addresses the "AI writes sloppy code" concern that CISOs and CTOs raise in procurement conversations.
Related Quality Metrics
Common questions
What are the key metrics included in the Larridin Quality tab?
The Larridin Quality tab includes sixteen metrics such as Innovation Rate, 30D/90D Turnover, Feature Ratio, Bug Fixes Ratio, AI Code Share, Review Speed, AI Slop Index, and Unit Tests, among others.
Why are these metrics important for engineering leaders?
These metrics provide a comprehensive view of code quality in AI-assisted environments, helping leaders manage code turnover, review processes, and the impact of AI on code quality.
How does the AI Slop Index differ from other metrics?
The AI Slop Index is unique to Larridin and identifies AI-generated code that is syntactically correct but semantically poor, addressing concerns about AI writing sloppy code.
How does Larridin's Quality tab benefit the C-suite?
It offers visibility across all sixteen critical metrics, helping CTOs and CISOs manage AI-assisted engineering teams more effectively than traditional dashboards.