
Enterprise AI Measurement Guide
Project Management
Project/Initiative Table
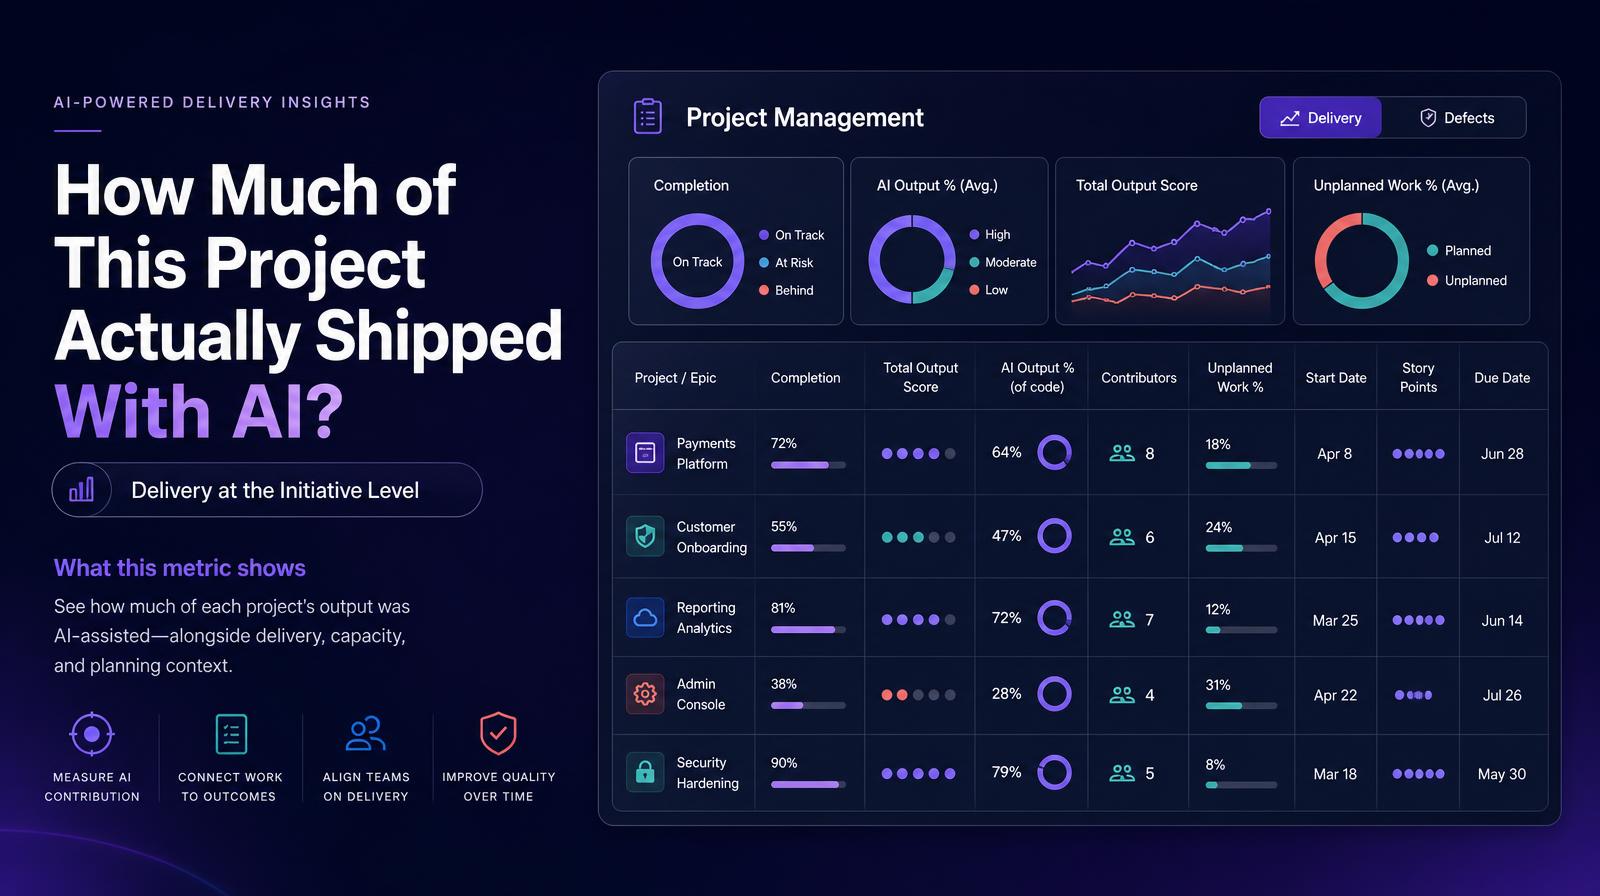
Which of our engineering projects show the highest AI Output %, and how do those projects compare on Completion %, Output, and Unplanned work?
What it shows
The Project Management table brings AI measurement to the initiative level, showing each project or epic's completion percentage, total output score, AI Output % (the share of that project's code that was AI-assisted), contributor count, unplanned work percentage, start date, story points, and due date. A Delivery/Defects toggle switches the view between delivery progress and defect rate for the same initiative. This is the first place in the dashboard where AI coding measurement connects directly to the project planning and delivery layer most engineering leaders live in daily.
Why it matters
Aggregate AI Output Share tells you how much AI-assisted code the org shipped overall. The Project Management table tells you which projects benefited from AI and which didn't, and whether the projects with the highest AI Output % are completing faster, with fewer defects, and less unplanned work than those with lower AI involvement. For CTOs making investment decisions about where to focus AI tooling rollout next, that initiative-level comparison is more actionable than any org-wide average.
The Larridin angle
The Unplanned % column surfaces the hidden productivity cost of reactive work, code written to fix things that weren't on the roadmap, which is disproportionately likely to appear when AI-generated code creates downstream defects. A project with 60% AI Output % and 40% Unplanned work is a different ROI story than one with 60% AI Output % and 8% Unplanned. Larridin surfaces both in the same row.
Related Project Management Metrics
Common questions
What does the AI Output % indicate in the Project Management table?
The AI Output % shows the share of a project's code that was assisted by AI, providing insight into how much AI contributed to the project's development.
How does the Delivery/Defects toggle function in the Project Management table?
The Delivery/Defects toggle allows users to switch between viewing the delivery progress and the defect rate for a particular initiative, offering a comprehensive view of project health.
Why is the Unplanned % column important in evaluating AI-assisted projects?
The Unplanned % column highlights the productivity cost of reactive work, which often arises from fixing issues not initially planned for, especially when AI-generated code leads to defects.
How can the Project Management table assist CTOs in making AI investment decisions?
The table provides initiative-level comparisons of AI Output %, helping CTOs assess which projects benefit most from AI and guiding strategic decisions on where to focus AI tooling efforts.