


AI spending doesn't always scale with seat counts. Larridin Spark data shows how costs can concentrate among heavy users, change from week to week, and complicate usage-based AI budgets.
TL;DR
The Short Answer
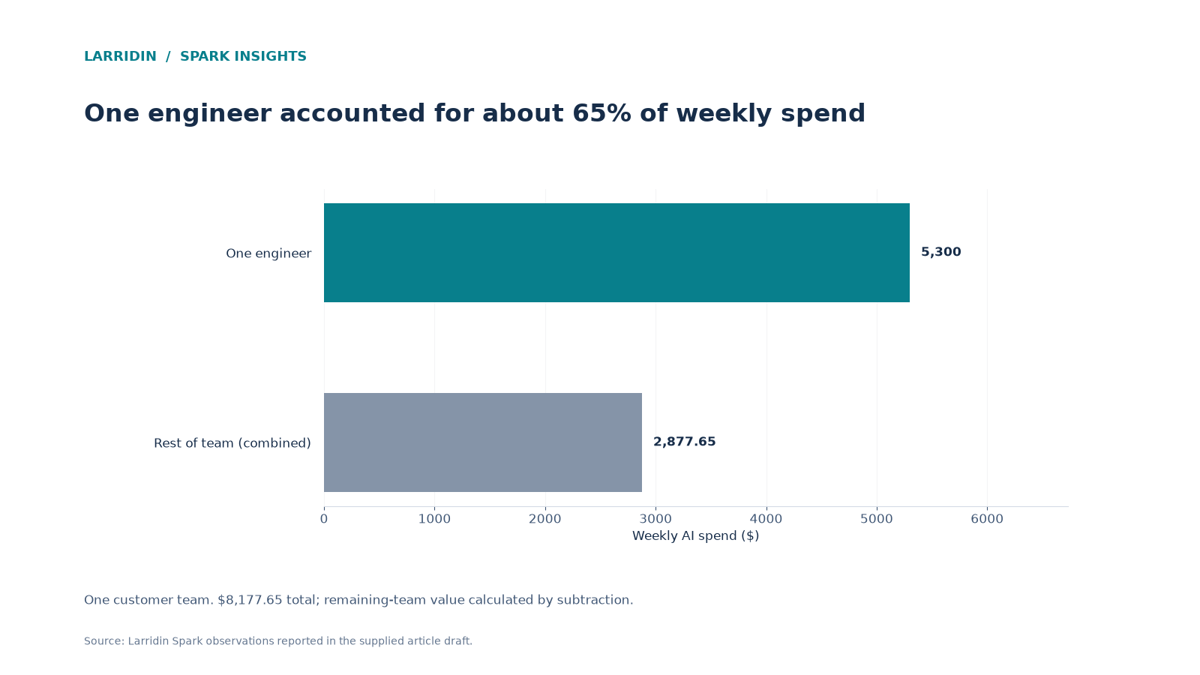
Per-seat budgets don't capture the full cost of usage-based AI tools. In one Larridin customer, a single engineer accounted for about 65% of a team's weekly AI spend. In another example, one engineer accounted for 55% of the organization's AI spend over 12 weeks. Finance teams need to track spending by user and evaluate it against output, not rely on seat counts alone.
Key Wins
- See why usage-based AI pricing breaks per-seat budgets
- Learn how concentrated AI spend can be, and why that isn’t always bad
- Use “cost per productive AI user” to plan and defend AI budgets
What’s a Spark Insight?
A Spark Insight is a data-backed finding Larridin surfaces automatically from how your teams actually use AI, flagging the patterns worth a leadership conversation.
Who This Matters To
CFO · CIO · Eng leaders
Quick Answers
| If you’re asking… | The answer | Go deeper |
|---|---|---|
| Why doesn’t per-seat budgeting work for AI anymore? | Many AI tools now combine seat licenses with usage-based charges, so seat counts alone can't predict the full cost. | Why it changed |
| How concentrated is AI spend? | Very, in some orgs. In Larridin data, one engineer accounted for about 65% of a team’s weekly AI spend, and in a 12-week view, one engineer drove 55% of org spend. | The data |
| What is cost per productive AI user? | AI spend divided by the number of people producing meaningful output with AI. It ties cost to value instead of to licenses. | Definition |
| How fast can AI spend grow? | Quickly. In one org, AI spend rose 494% over 12 weeks. | The data |
Per-seat pricing makes software budgets relatively predictable: multiply the license cost by the number of users. Usage-based AI costs are harder to forecast because people consume very different amounts, even within the same team.
What You’re Struggling With, and How to Fix It
| What you’re struggling with | What you actually need | How Larridin helps | Proof from Spark data |
|---|---|---|---|
| “Our AI bill doesn’t match our seat count.” | Spend by person and tool, not by license | Tracks AI spend at the user level across tools | One team: one engineer ~65% of weekly AI spend |
| “Spend jumped and I don’t know why.” | Trend data that shows who and what drove the change | Shows spend growth by person, team, and tool over time | One org: AI spend +494% over 12 weeks |
| “I can’t tell if high spenders are worth it.” | Spend tied to output | Pairs spend with engineering output metrics | Top spender led CAV (120.1), but 9.5% code turnover warrants quality review |
What This Means for You
If you’re a CFO
The question you’re asked: “How do I budget for AI when the price isn’t fixed?”
What to do: Model spend by usage tiers and track cost per productive AI user. Model the possibility that a few heavy users drive a large share of the bill.
For more on financial oversight, see AI Monitoring for CFOs: Turn Untracked Spend Into Measurable ROI.
If you’re a CIO
The question you’re asked: “Who is driving our AI spend?”
What to do: Get user-level visibility across tools. Then decide whether high spend reflects high value or needs guardrails.
For more on shared AI spending accountability, see Why CIO and CFO Cannot Agree on AI Accountability.
If you lead engineering
The question you’re asked: “Should I cap heavy AI users?”
What to do: Check their output first. In one org, the top spender was also a top performer. Set guardrails on waste, not on productive use.
For more on evaluating engineering AI investments, see AI Monitoring for Engineering Leaders.
What the Sparks Data Shows
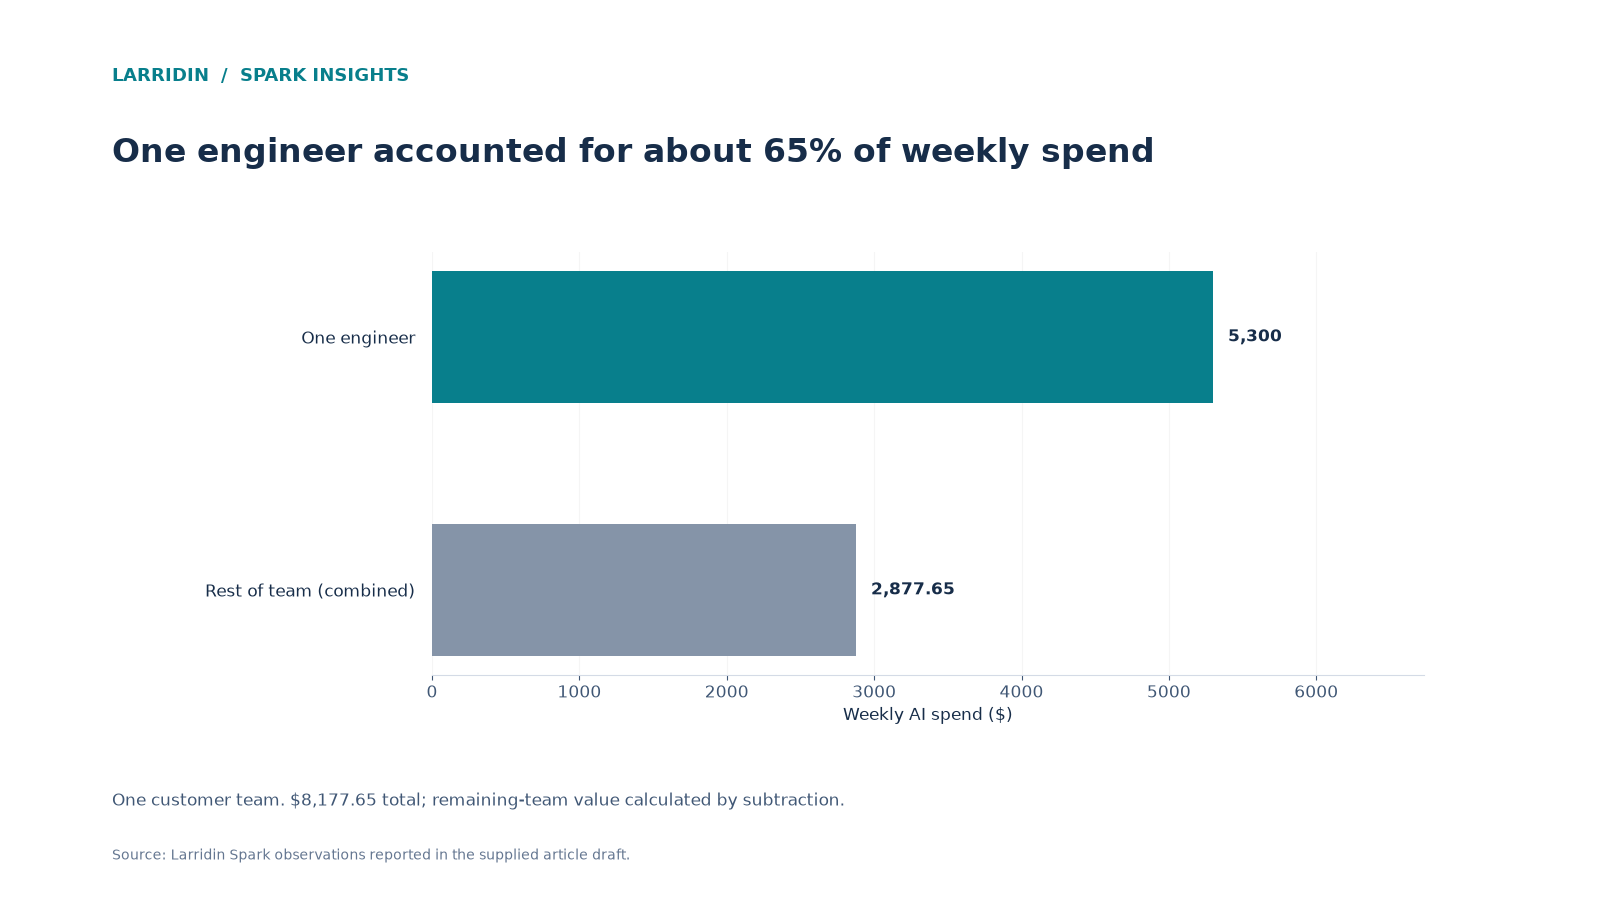
- About 65%: In one customer organization, a single engineer accounted for $5,300 of a team's $8,177.65 in weekly AI spend. Several teammates spent between $0 and $300 that week.
- 55%: In another customer example, one engineer accounted for $65,943 of the organization's $119,617 in AI spend over 12 weeks. Overall spend increased 494% during that period.
- In Larridin's internal data, weekly Codex spend rose from about $2,400 in mid-July to $12,800 in late September, accounting for roughly 62% of that week's AI spend. The top three users accounted for about 24% of total spend.
High spend isn’t always waste: The engineer responsible for 55% of one organization's AI spend also had the team's highest complexity-adjusted velocity (120.1). However, their 30-day code turnover rate was 9.5%, more than twice that of a comparable heavy AI user. High output doesn't automatically mean every dollar is well spent.
Why Is Cost per Seat Dead for AI?
Because seat counts alone can't predict costs when AI usage is billed through tokens and credits.
GitHub Copilot adopted usage-based AI credits on June 1, 2026, adding token-based consumption to plans that still include subscription pricing. Gartner predicts AI coding costs will exceed the average developer's salary by 2028. As consumption-based pricing expands, seat counts become less useful for forecasting the full bill.
Usage also varies enormously by person. A few heavy users can drive most of the spend while many others barely register.
Spark callout: In one team, a single engineer accounted for $5,300 of $8,177.65 in weekly AI spend, about 65%. Several teammates spent between $0 and $300 that week.
Myth: AI costs scale with the number of seats.
Reality: In one org, one engineer drove 55% of 12-week AI spend.
What Should You Budget by Instead?
Cost per productive AI user.
Divide AI spend by the number of people producing meaningful output with AI. That ties the budget to value and makes it easier to defend. It also shows when spend is rising without matching output, which is the real budget risk.
Define “productive” with a consistent, role-appropriate outcome and measurement period before calculating this ratio. Use billed costs for budgeting, and keep usage-cost estimates labeled separately.
Should You Cap Your Heaviest AI Users?
Not before you know what they’re producing.
In one org, the engineer responsible for 55% of AI spend also led the team in complexity-adjusted velocity. But their higher code-turnover rate shows why output quality matters, too. Before setting spending limits, compare costs with both productivity and quality metrics.
How to Budget for Usage-Based AI
- Get user-level spend across all AI tools. Seat counts won’t show it.
- Identify concentration. Find the share of spend from your top users.
- Pair spend with output. Separate productive heavy use from waste.
- Budget by cost per productive AI user. Compare user-level AI spending with engineering output. Larridin's Token Spend & Insights helps track and attribute AI costs.
Frequently Asked Questions
What is usage-based AI pricing?
Pricing based on how much a tool is used, often measured in tokens or credits, rather than a flat fee per user.
Is concentrated AI spend a problem?
Not necessarily. It can reflect your most productive users. It becomes a problem when high spend has no matching output.
How do I forecast AI spend under usage pricing?
Use recent usage trends by person and tool, plan for heavy-user growth, and review monthly. Expect larger swings than with flat-rate software.
Spark a Discussion About Where Your AI Budget Is Really Going
See AI spend by person, tool, and output in your org, and bring it to your next budget review.