

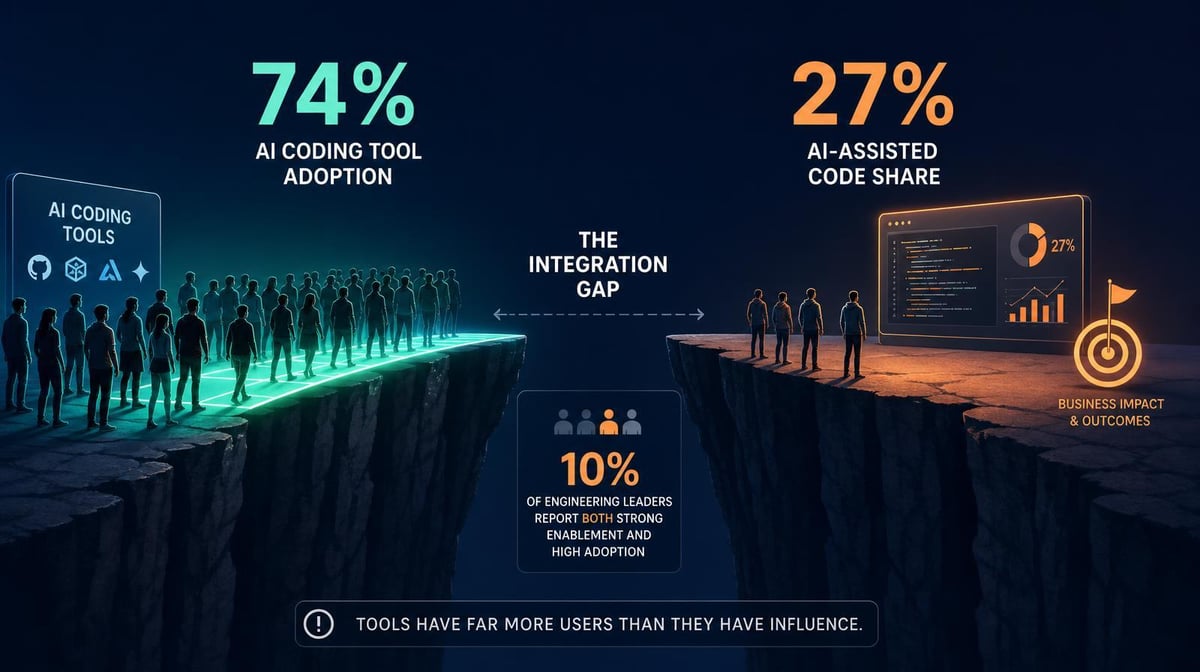

High adoption doesn’t necessarily mean AI is part of the daily development workflow. A license or weekly login tells you whether a tool is available and being used. It doesn’t tell you how often developers use it, how much of their work involves AI, or whether that use is improving delivery.
Key Takeaways
- DORA’s 2025 research found that 90% of technology professionals use AI at work. But DORA’s broader conclusion is that AI acts as an amplifier: results depend on the systems and practices around the tools, not adoption alone.
- The Stack Overflow 2025 Developer Survey found that 84% of respondents use or plan to use AI tools in development, while 51% of professional developers use them daily. Those figures aren’t a single 33-percentage-point “integration gap,” but they do show why broad adoption numbers and depth of use should be measured separately.
- Larridin’s 2026 Developer Productivity Benchmarks separate tool access, weekly active usage, power-user density, and AI code share. Once adoption is established, measuring AI code share helps show whether developers are incorporating AI into actual engineering work.
Why Adoption and Integration Are Different
Adoption is a useful starting point, but it can describe several different behaviors. A developer who uses an AI tool occasionally and one who relies on it throughout the day can both count as active users. The adoption number alone can’t show the difference.
For engineering leaders, it helps to ask three separate questions:
- Access: Who has an AI coding tool available?
- Activity: Who’s actually using it, and how often?
- Integration: How much of the team’s engineering work involves AI assistance?
Larridin’s benchmarks treat these as separate signals. Tool coverage measures access. Weekly active usage shows whether people are using the tools. Power-user density adds depth by looking at daily, multi-feature use. AI code share measures how much engineering output involves AI assistance.
Daily use is helpful to know, but it still doesn’t provide a complete picture. A developer can use AI every day for documentation, search, or isolated boilerplate without relying on it for a meaningful share of coding work. AI code share adds that missing context. Delivery and quality measures then show whether deeper use is actually helping. Together, the metrics separate activity from integration and integration from impact.
That distinction matters because each signal points to a different problem. Low access may be a licensing or rollout issue. High access with low active usage suggests developers aren’t picking up the tools. Strong active usage with low AI code share can indicate that AI is being used only for simpler tasks rather than becoming part of the core workflow.
3 Usage Patterns Behind an Adoption Number
1. Integrated Users
These developers use AI regularly as part of their normal development work. Their usage goes beyond opening the tool or trying occasional suggestions. For this group, the next question is whether deeper AI use is improving delivery without increasing rework or hurting code quality.
2. Occasional Users
These developers use the tool enough to appear in an adoption or weekly activity metric but haven’t built it into much of their workflow. This group can make an adoption rate look healthy even when AI-assisted output remains limited.
The useful question is why usage stays shallow. The answer may be task fit, workflow friction, weak onboarding, or uncertainty about where the tool is useful. Usage data shows the pattern; developer feedback helps explain it. We recommend investigating usage barriers rather than assuming lack of interest or ability.
3. Licensed Non-Users
Some developers have access but rarely or never use the tool. That doesn’t automatically mean resistance. We recommend investigating adoption barriers such as lack of onboarding, IDE compatibility, workflow mismatch, or security review delays before treating non-use as a performance problem.
What Deeper Integration Looks Like
There’s no single AI code share that every engineering organization should target. Codebase complexity, risk, tooling, and the kinds of work a team performs all affect what healthy integration looks like.
Larridin’s Developer Productivity Benchmarks 2026 provide reference points across several dimensions rather than treating adoption as a standalone score. Its elite-team profile combines more than 80% weekly active usage, high AI-assisted code share, fast PR cycle times, and a low AI-to-human code turnover ratio. The point is the combination: higher AI use should be evaluated alongside delivery and quality.
Larridin also recommends comparing teams internally before leaning heavily on external benchmarks. Differences in codebases, tooling, and culture can make an external percentage look more precise than it really is. Your strongest internal teams can show what effective integration looks like in your environment.
That also prevents the benchmark from becoming the goal. A team shouldn’t push AI code share higher simply to reach an external range. If review time, defects, or turnover rise at the same time, deeper usage may be creating more work instead of more value.
How to Close the Gap
Start by finding where the drop-off occurs. If most developers have access but weekly usage is low, focus on adoption barriers. If weekly usage is strong but AI code share stays low, look at which tasks developers use AI for and where the workflow breaks down. If AI code share rises but quality deteriorates, the problem is no longer adoption. It’s how the tools are being used and reviewed.
Peer behavior can also matter. Microsoft’s 2026 field study of Claude Code and GitHub Copilot CLI found that peer usage was strongly associated with first use, while retention was associated more with coding activity than demographics. The study doesn’t show that mandates fail, but it does support making successful peer use visible as part of rollout design.
The goal is enough depth of use to improve engineering outcomes without creating more rework, quality problems, or unnecessary spend.
Frequently Asked Questions
What’s a healthy AI code share for a team with high adoption?
There’s no universal percentage. Start with your team’s own baseline and track AI code share alongside quality and delivery. Larridin’s benchmarks recommend comparing teams internally first, then using external ranges for context. High AI code share isn’t automatically better if code turnover or rework rises with it.
Why does DORA report 90% AI use while Stack Overflow reports 84%?
The surveys measure different populations and ask different questions. DORA’s 2025 research covers technology professionals and reports that 90% use AI at work. Stack Overflow surveyed developers and found that 84% use or plan to use AI tools in their development process. The figures show that AI use is widespread, but they shouldn’t be treated as directly comparable adoption rates.
How do we measure AI code share alongside adoption?
Measure access and activity separately from engineering output. Larridin’s AI Dev Productivity platform connects AI contribution data with GitHub, Jira, delivery, and quality signals. That lets leaders compare AI usage with what teams ship instead of using logins as a proxy for impact.
What does DORA mean when it says AI is an amplifier?
DORA’s 2025 report found that AI magnifies existing organizational strengths and weaknesses. Strong platforms, workflows, and operating practices can help teams get more from AI. Weak systems can create more friction or instability as AI use expands. That’s why increasing access alone isn’t a complete rollout strategy.
Measure More Than the Adoption Headline
Larridin separates AI adoption from the engineering signals that show whether the tools are becoming part of the work. Tracking access, active usage, AI code share, delivery, and quality together gives engineering leaders a clearer view of where adoption is working and where it has stalled.
Book a discovery call to measure your AI adoption and integration.