
Enterprise AI Measurement Guide
Cost
Team Level Breakdown
How do we see each engineer's AI tool cost broken down by week and filterable by source in the Cost tab?
What it shows
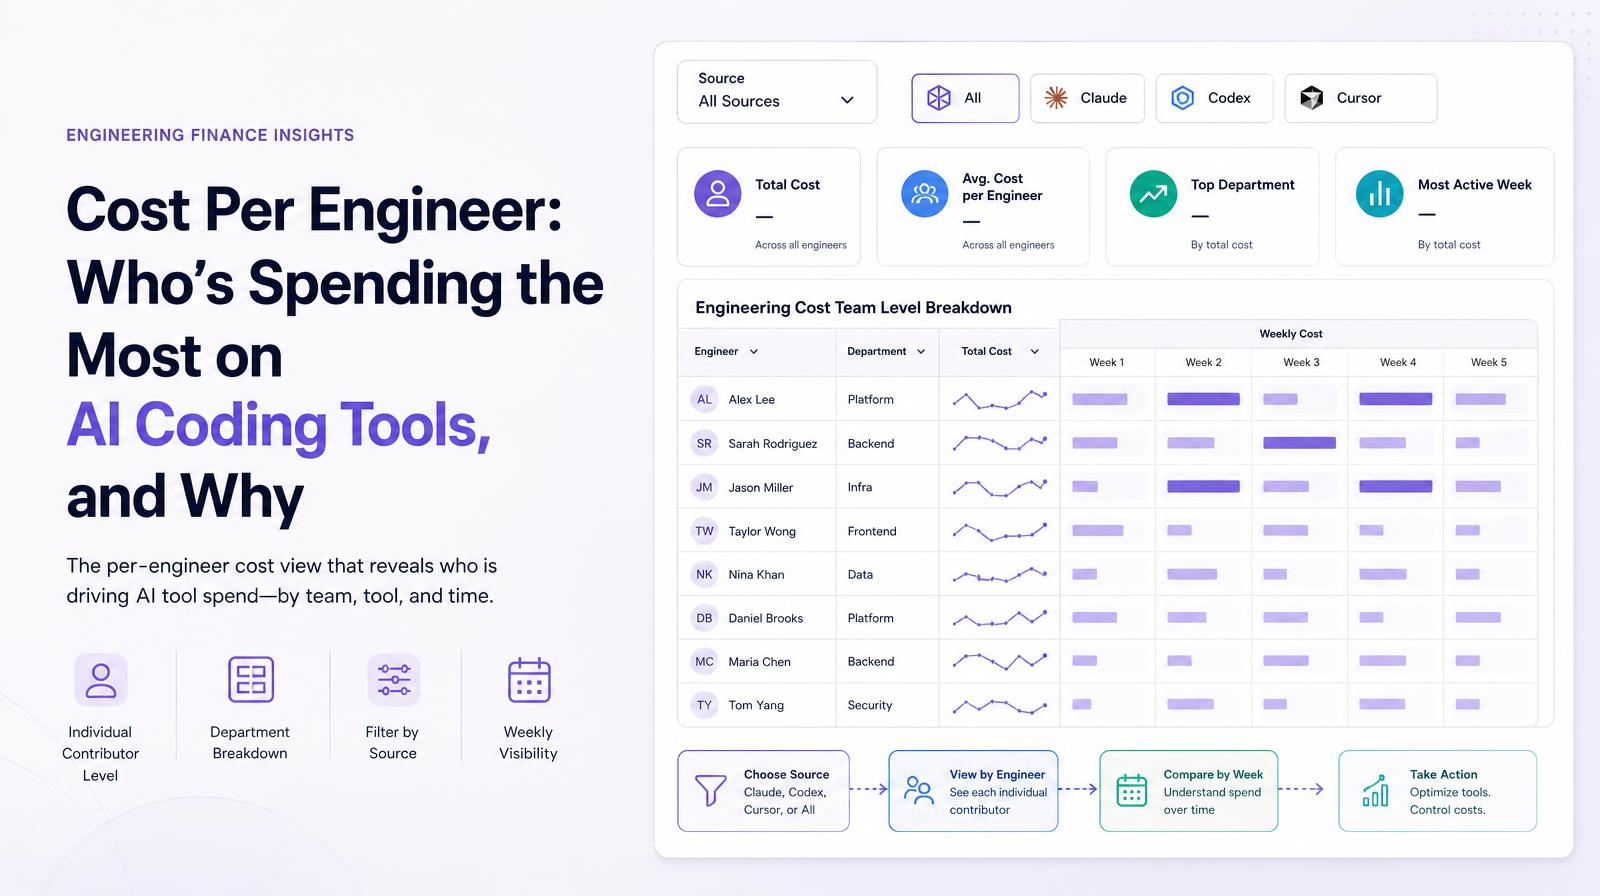
The Engineering Cost Team Level Breakdown table shows each individual contributor's department, total AI tool cost for the period, and a weekly cost column for each week in the window, filterable by source so leaders can see what any individual spent on Claude specifically, on Codex, on Cursor, or across any combination. It is the per-engineer cost view that makes the "who is driving our AI budget" question answerable with data rather than guesswork.
Why it matters
Per-seat pricing assumes AI tool cost scales evenly with headcount. It doesn't. Larridin's own customer data shows single engineers generating 60-65% of an entire department's weekly AI spend in peak weeks, while colleagues sit at near-zero. Without per-engineer cost data, that concentration is invisible, and without the output data alongside it, there's no way to know whether the concentration is productive or wasteful. This table is the starting point for every cost-efficiency conversation at the engineering department level.
The Larridin angle
The source filter makes engineering cost management precise: if a CTO wants to know which engineers are driving the Cursor bill specifically, separate from the Claude Code or Codex spend, this table answers it directly. That granularity is essential when making tool rationalization decisions, where the question isn't "how much does AI cost?" but "how much does this specific tool cost, per person, and is that person producing more because of it?"
Related Cost Metrics
Common questions
What does the Engineering Cost Team Level Breakdown table show?
The table displays each individual contributor's department, total AI tool cost for the period, and a weekly cost column for each week, filterable by source.
Why is per-engineer cost data important for the C-suite?
Per-engineer cost data reveals the concentration of AI tool spending, which can be invisible without this granularity, helping assess whether spending is productive or wasteful.
How does the source filter enhance cost management?
The source filter allows precise identification of which engineers are driving costs for specific AI tools, aiding in tool rationalization decisions.
How can leaders assess the value of AI tool spending?
By comparing the cost data with output data, leaders can determine if the concentration of AI tool spending is creating value or is wasteful.