


A developer can accept nearly every suggestion from an AI coding assistant and still ship less useful software.
That’s why AI-assisted developer productivity can’t be reduced to one score.
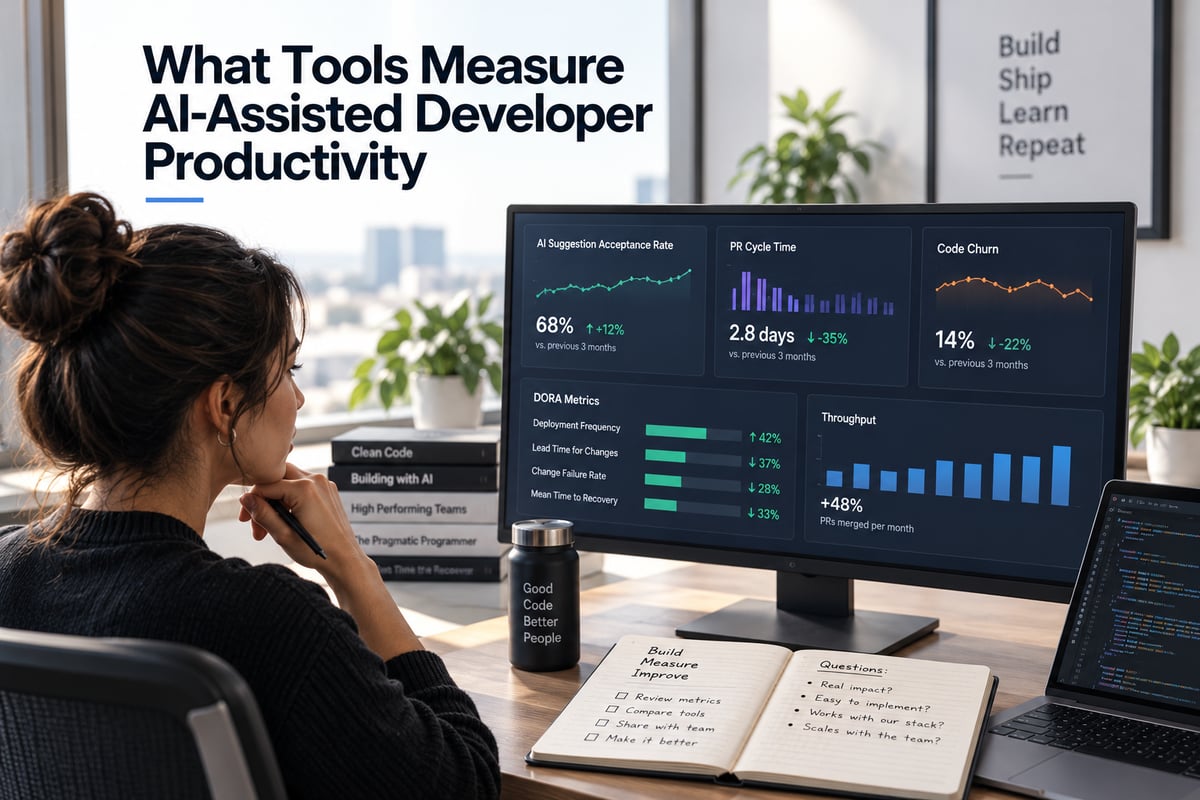
Five signals give you a much clearer picture: AI suggestion acceptance, code churn, PR cycle time, DORA metrics and throughput.
GitHub Copilot now reports adoption, acceptance, lines of code and pull request activity. Engineering intelligence platforms such as DX, Jellyfish, Faros AI, LinearB and Swarmia connect those signals with broader delivery data.
The important part isn’t finding one perfect metric. It’s following the work from AI use to code that survives review and reaches production.
This guide covers the five metrics that help separate real productivity gains from more activity.
Follow the work from AI use to production
Vendor comparisons usually start with “which platform should I buy?”
Start one step earlier.
What should you measure before deciding whether AI is helping your engineering team?
The five metrics below follow the path from using an AI tool to shipping working software.
|
Metric |
What it captures |
Where it can mislead |
Tools that capture it well |
|---|---|---|---|
|
AI suggestion acceptance rate |
How often developers keep AI suggestions |
Doesn't show whether the code survives |
GitHub Copilot metrics, LinearB, Larridin |
|
Code churn and rework |
How quickly newly written code gets changed or deleted |
Merge counts can look healthy while rework climbs |
GitClear, Faros AI, Larridin |
|
PR and review cycle time |
How long code takes to move from first commit through review and deployment |
Faster coding can push the bottleneck into review |
LinearB, DX, Jellyfish, Swarmia |
|
DORA metrics |
Delivery speed and stability |
More deployments don't guarantee healthier software |
Faros AI, DX, Jellyfish, LinearB |
|
Throughput |
PRs merged, tickets closed and other output measures |
More activity doesn't always mean more value |
Jellyfish, DX and most engineering analytics platforms |
Start with AI suggestion acceptance rate
Acceptance rate measures how often a developer keeps an AI-generated suggestion instead of rejecting it.
GitHub includes acceptance rate among its Copilot usage metrics. Because the IDE captures this telemetry, it’s one of the easiest AI coding metrics to collect.
It’s also easy to overvalue.
A developer might accept most AI suggestions, then spend hours rewriting the resulting code. Acceptance tells you that the developer chose to use the suggestion. It doesn't tell you whether the code saved time or survived review.
That distinction matters.
In our research into engineering teams, the top 6% of AI users saved more than twice as many hours as the average user. They had access to the same AI tools.
The difference was how effectively they used them.
DX's Core 4 framework combines output measures with developer experience data. That adds context that a simple acceptance percentage can't provide.
Our Developer Intelligence product takes a similar approach. It connects AI activity with engineering output, quality and delivery signals.
Acceptance rate is useful. Treat it as the beginning of the measurement chain, not the answer.
Watch code churn and rework
Code churn measures code that gets rewritten or deleted soon after it was created.
For AI-assisted development, this can show whether fast code generation is creating work that the team has to do again.
That’s different from tracking production bugs. Churn asks a simpler question.
Did the code stick?
GitClear’s 2026 analysis examined 623 million changes from 2023 through 2026. It found two-week code churn had increased 15% versus earlier levels.
Refactoring-style line moves were down 70% compared with 2022. Copy-and-paste changes climbed from 9.4% in 2022 to 15.7% during the first half of 2026.
Put those signals together and you see something acceptance rate alone misses. Teams can produce more code while creating more future cleanup.
GitClear is useful if churn is your main concern. Its current Starter plan is free for small projects with up to three repositories.
Faros AI can connect engineering delivery signals with AI activity at a broader organization level.
We've also written about why code churn has risen during the AI coding era.
The goal isn't to treat every rewritten line as a problem. It's to see whether increased AI use is creating a persistent rise in work that has to be done twice.
Measure where PR cycle time moves
Cycle time measures how long code takes to move from development into production.
A useful breakdown includes four stages.
- Coding time
- Pickup time
- Review time
- Deploy time
AI can change the balance between them.
Coding time may fall because an assistant produces a first draft faster. Review time doesn't automatically fall with it.
Reviewers may now face more code or larger changes.
That means AI can remove one bottleneck and create another.
Time to first review becomes especially useful here. If developers produce PRs faster but those PRs sit untouched longer, total delivery speed may not improve much.
LinearB and Swarmia both provide detailed views of engineering flow. Jellyfish connects delivery data with resource allocation and business initiatives. DX combines PR analytics with its broader engineering measurement framework.
Larridin takes a different approach. Developer Intelligence connects AI coding activity with engineering output, quality, reliability and spend rather than treating AI usage as a separate dashboard.
That distinction matters when choosing a tool. Some products specialize in the delivery pipeline. Others focus on connecting AI use with what engineering actually produces.
Keep the classic DORA metrics in the picture
DORA has historically centered on four software delivery metrics.
Deployment frequency tracks how often software ships.
Lead time for changes tracks how quickly a change reaches production.
Change failure rate looks at deployments that create failures.
Mean time to restore measures how quickly teams recover.
DORA expanded its software delivery performance framework from four metrics to five in 2025. The classic four still appear throughout engineering measurement products, so they remain useful when evaluating AI-assisted development.
DORA’s 2025 research also found something especially relevant to AI.
AI can improve throughput, but stability depends heavily on the engineering system underneath it. DORA describes AI as an amplifier.
That means faster output isn't enough.
Deployment frequency and lead time can improve while failure rates move in the other direction.
Faros AI and DX both make delivery metrics a major part of their engineering intelligence products. Jellyfish and LinearB also include DORA-style delivery measurements alongside broader engineering analytics.
If your existing CI/CD stack already provides this event data, you might not need another platform just to calculate DORA metrics.
Our DORA metrics guide explains how each measure works.
The added value of an AI measurement platform is connecting delivery performance with who is using AI, how they're using it and what happens afterward.
Treat throughput as context
Throughput is easy to understand.
PRs merged. Tickets closed. Work shipped.
It's also easy to misread.
An AI assistant can help a developer split one change into several smaller PRs. The PR count goes up even though the amount of useful software delivered hasn't changed.
That doesn't make throughput useless.
It makes throughput a supporting metric.
Jellyfish combines engineering activity with allocation data so leaders can see what work consumed engineering capacity.
DX includes output within its Core 4 framework instead of treating raw output as the complete productivity measure.
The same principle applies across platforms.
A rising PR count becomes much more useful when you can compare it with cycle time and rework.
More output with shorter cycle time and stable rework tells a different story than more output with rising churn.
Pick a tool based on the question
Start with the question you need the data to answer.
If you want to know whether your engineering delivery system is healthier, Faros AI and DX are worth evaluating. G2 currently rates Faros AI 4.8 out of 5 and DX 4.6 out of 5.
If you need to understand where work slows between coding and deployment, LinearB focuses heavily on engineering workflow and cycle-time measurement. Its current Business plan is listed at $49 per month on G2.
If the conversation includes engineering allocation and business planning, Jellyfish is built around connecting engineering work with company priorities. G2 currently rates it 4.5 out of 5 across 429 reviews.
Swarmia combines engineering productivity measurements with AI adoption, activity and cost data. Its standalone AI adoption and cost product is currently listed at $5 per developer per month when billed annually.
Larridin addresses a somewhat different question.
Are AI tools improving engineering output and quality, and what are we getting for the money we're spending on them?
Developer Intelligence connects engineering performance, AI coding activity and AI spend. It follows work from an agent session through merged code and production outcomes.
If you only need basic pipeline metrics, a specialized engineering analytics product may be enough.
If you need to connect AI use and AI spend with engineering outcomes, that additional measurement layer becomes much more important.
Before choosing any platform, ask a few simple questions.
- Where does its AI usage data come from?
- Can it separate coding, pickup, review and deployment time?
- Can you compare delivery quality before and after AI adoption?
- Can you see the math behind any composite productivity score?
If the vendor can't explain how a metric is calculated, don't put that number in front of leadership.
Start with your current bottleneck
No single metric can tell you whether AI has made an engineering team more productive.
Acceptance rate tells you whether developers use the suggestions.
Churn tells you whether the resulting code sticks.
Cycle time shows whether work moves faster.
DORA metrics tell you whether faster delivery remains stable.
Throughput shows how much work is moving through the system.
You don't need all five on day one.
Start with the metric closest to your current bottleneck. Then add the next signal that helps explain what changed.
The goal isn't a prettier productivity score.
It's knowing whether AI helped your team ship better software with less effort.
For more on connecting engineering AI usage with business outcomes, see our AI monitoring guide for CIOs and our AI monitoring guide for CISOs.
Want to see how AI coding activity connects with engineering output, quality and spend? Explore Larridin Developer Intelligence.