


By the Larridin Team
Measuring AI’s impact on engineering output means tracking whether AI tools actually change what an engineering organization ships, not just how much activity appears in a dashboard. A team can generate more pull requests, more commits and more lines of code with an AI coding assistant installed and still ship the same amount of real, shippable work as before AI. Activity went up, output didn’t change. So what was AI’s impact, if any?
That lack of a definitive answer to the “AI impact” question means most enterprise organizations aren’t prepared to answer the CFO’s question on AI ROI. This guide covers four important components of measuring AI’s impact on engineering output. They are 1.) what output actually means in an AI context; 2.) AI engineering impact metrics that help distinguish real output from busywork, 3.) how to build engineering output measurement into your own organization, and 4.) common mistakes and how to avoid them.
What does it mean to measure AI’s impact on engineering output?
Engineering output is the work that reaches production and creates value. It includes features shipped, incidents resolved, systems migrated, technical debt paid down. Engineering activity is everything that happens on the way there: commits, PRs opened, lines changed and AI suggestions accepted, for example. AI tools raise activity almost automatically. Whether these same tools raise output is a separate and harder question. It’s also the question leadership actually cares about.
The CFO may phrase the AI impact question in this way, for the same team, doing comparable work, is more of it reaching production per unit of time and cost since AI entered the workflow? A useful measurement program can answer that question at the team level and the organizational level. It can also explain how the numbers were built.
Other critical metrics take surface-level data measurements one step further. For example, AI adoption may reveal that 80% of engineers opened Copilot this month, but it doesn’t tell you if the high adoption percentage yielded increased productivity. Other key measurements include AI impact on code quality, ship volume, and rework debt. As in, maybe ship volume was constant while a team quietly accumulated rework debt that only shows up two quarters later.
Measuring AI impact is different from expressing AI ROI on engineering as a single dollar figure. A finance-friendly ROI number is downstream of the output measurement. You can’t credibly put a dollar value on what AI returned to engineering until you’ve isolated what changed in actual delivered work. That isolation is harder, less glamorous and often the job most reporting skips.
Why most engineering orgs measure AI impact wrong
For some, the default (easy) reporting instinct is to use figures provided by the AI vendor, such as suggestion acceptance rates, lines of AI-generated code and seats activated. Those numbers are easy to pull, but don’t address the output question. None reveal what left the sprint and reached a customer. A second common mistake is picking a single global metric, like PR count, and trusting it across every team. PR count reflects team norms as much as it reflects output. A team that ships in small, frequent PRs will always out-count a team shipping large, infrequent ones, whether or not AI is involved. Comparing those counts head-to head-produces a ranking that has nothing to do with actual output.
The third mistake is comparing this quarter to last quarter without holding anything else constant. Headcount changes, a major migration, a hiring freeze or a shift in product priority will all move output independent of AI. A measurement that can’t separate “AI helped” from “we hired three senior engineers” isn’t measuring AI’s impact; it’s measuring the quarter.
A fourth, quieter mistake is treating engineering output measurement as a one-time report. Usage patterns shift every time a team adopts a new model, a new IDE plugin or a new internal workflow. A baseline built in January and never revisited says less about June than a rough estimate would.
The signals that actually separate output from activity
A defensible AI impact on output measurement combines a handful of metrics or signals that, when taken individually can mislead, but together triangulate on the real answer. The metrics include
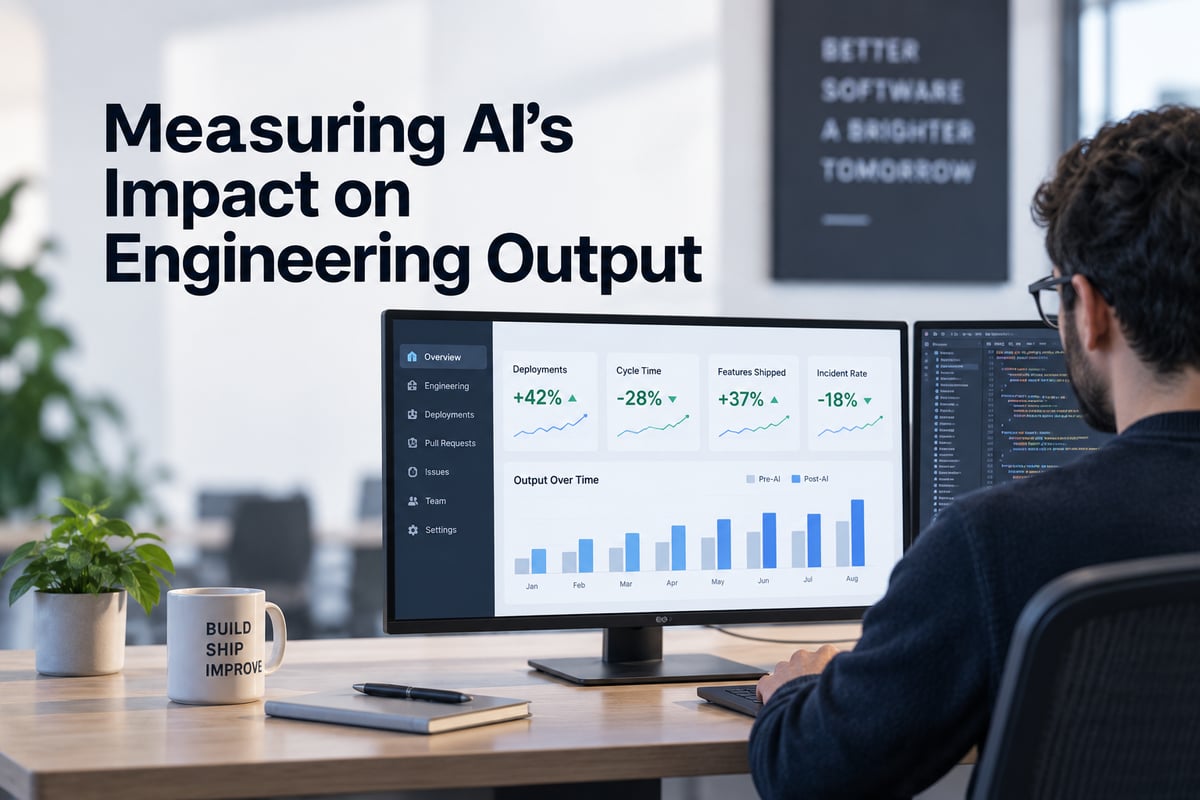
- Deployment frequency and lead time for changes, tracked as a trend rather than a single snapshot, since a one-time jump can be noise
- Story points or features shipped per engineer per sprint, held against a stable Jira/Linear taxonomy so the comparison is apples to apples over time
- Cycle time from ticket start to production, broken into the stages where AI is actually inserted versus the stages it isn’t involved at all
- Engineering capacity freed up: hours no longer spent on the AI-handled task, and where that time actually went (new work, or absorbed into meetings)
- Rework rate on AI-assisted work, since output that has to be redone within weeks was never really delivered
No single line in that list proves impact on its own. A rising deployment frequency next to a falling cycle time and a flat or falling rework rate is a real signal. A rising deployment frequency next to a rising rework rate usually means the team is shipping faster and breaking more. That’s a different story entirely.
The right unit for most of these signals is the team, not the individual and not the whole department. Individual-level data is too noisy. One engineer’s slow week rarely means anything. Department-level data is too blended too: five teams with five different AI adoption curves average into a meaningless flat line. Team-level trends, tracked over a full quarter, are usually where real patterns appear.
How to measure AI’s impact on engineering output in your organization
Set this up in six steps, in order:
- Baseline the metrics above for each team for the 8-12 weeks before broad AI rollout, or the earliest clean window you have. Without a real baseline, every later number is a guess dressed up as a measurement.
- Instrument AI usage separately from output metrics, so you can see who’s actually using which tools for which tasks, not just who has a license. We built Larridin for exactly this layer. Scout, our core platform, captures cross-platform AI usage without reading code or document content. That gives you real usage data without a compliance problem.
- Segment by team and by task type before you segment by anything else. A platform team’s AI-assisted output looks nothing like a product team’s, and blending them erases the pattern in both.
- Hold a control group if possible. An informal one works, like two comparable teams where AI rollout happened a month apart. That gives a natural before/after comparison that a single-team trend line can’t.
- Report output and rework side by side, every time, on a fixed cadence. A number reported once at a board meeting and never checked again isn’t a measurement program; it’s a slide.
- Revisit the baseline itself every two quarters. Team composition changes, tools change, and a baseline that’s a year old is measuring a team that no longer exists in the same shape.
Most of this is achievable with a spreadsheet and a few hours a month for a single team pilot. The measurement stops scaling once you try to run it across ten teams by hand. That’s the point where most engineering departments bring in a platform to automate the AI usage side of the equation. It connects that to the delivery data already tracked in Jira, Linear or GitHub. Our own developer productivity page walks through how Larridin approaches the connection.
Common mistakes when measuring AI’s engineering impact
Most of these mistakes come from the same root cause. Teams measure AI’s impact on engineering the same way they’d measure a single tool rollout. Instead, treat AI as a sea change to how work moves through the pipeline instead.
- Mistake #1: Trusting the AI vendor’s own usage dashboard as a reliable output metric. Copilot’s suggestion-acceptance number describes Copilot. It doesn’t describe your sprint velocity, your deploy cadence or your defect rate. Treat it as one signal, among several, never as the entire number.
- Mistake #2: Measuring at the individual level and reporting at the org level without checking the distribution. In our own research into engineering teams, the top 6% of AI users saved more than double the hours of the average user. They were using the exact same tools as everyone else. An org-wide average buries that gap completely and tells leadership nothing about where to focus enablement.
- Mistake #3: Declaring victory on a single metric. A team that doubles deployment frequency while its change failure rate triples hasn’t proven AI is working. It’s proven the team is shipping faster and rolling back more, which costs more than it saves once you count the incident time.
- Mistake #4: Skipping the baseline because leadership wants a number now. A number produced under pressure without a comparison point is a guess. It’s better to say “we don’t have a defensible answer yet, here’s when we will” than to hand over a fabricated-looking win.
What this looks like in Larridin
Scout captures cross-platform AI usage across the tools your engineers already use. Our Engineering Intelligence module then ties that usage data to the output signals previously described: deployment frequency, cycle time, rework rate and capacity freed up. All the data lives in one place instead of stitched together from five exports. We measure everything against Utilization x Proficiency x Value. Utilization is who’s using AI. Proficiency is how well they’ve built it into real workflows. Value is whether output actually moved because of it.
That third layer, Value, is where most AI measurement tools fail. A platform can tell you usage is up and stop there. We tie usage back to the deployment frequency, cycle time and rework numbers that engineering leadership already reports on. That way the AI impact conversation uses the same numbers as every other engineering conversation, instead of a separate, unverifiable figure.
Other tools for measuring AI’s impact on engineering output
DX (rated 4.6/5 on G2 from 342 reviews) goes deepest on the developer-experience side of the output question. Its Core 4 framework and Developer Experience Index pair sentiment data with system metrics. That makes it a strong fit if you want the human half of the output story alongside the numbers.
Faros AI (4.8/5 on G2 from 12 reviews) is DORA-metrics-first, built specifically to instrument deployment frequency, lead time, change failure rate and MTTR at the pipeline level. If code-level delivery instrumentation is the gap in your current setup, it may fill that directly.
Jellyfish (4.5/5 on G2 from 429 reviews) rolls engineering output up into allocation and investment reporting. That’s useful if your output conversation is really an engineering-spend conversation aimed at finance and the board.
LinearB (4.6/5 on G2 from 80 reviews) priced at $29 or $59 per user per month depending on tier) covers the PR and code-review cycle-time layer well. It has also added an AI adoption and cost add-on. That makes it a reasonable single-vendor option for engineering-only teams that don’t need the cross-functional view.
The first four platforms cover pure engineering-pipeline instrumentation. The Larradin difference is connecting that instrumentation to usage and value across the rest of the business, not just inside engineering.
Start with the teams furthest along
Engineering output was hard to measure before AI arrived, and AI didn’t fix that. It made the measurement more urgent. The gap between “activity looks up” and “output actually moved” is exactly where AI tools inflate the first number without touching the second. The teams that get a real answer baseline first, segment by team and task, and report rework next to every output number they publish. Start with one or two teams where the AI rollout is furthest along. Build the baseline-to-current comparison there, and prove the method before rolling it out org-wide. A measurement approach that only works with a full year of clean data behind it will never get built. One that works with eight weeks of data gets used and makes an impact.
Want to see AI usage connected to your own engineering output metrics? Request a Larridin demo and we’ll walk through your team’s data.