

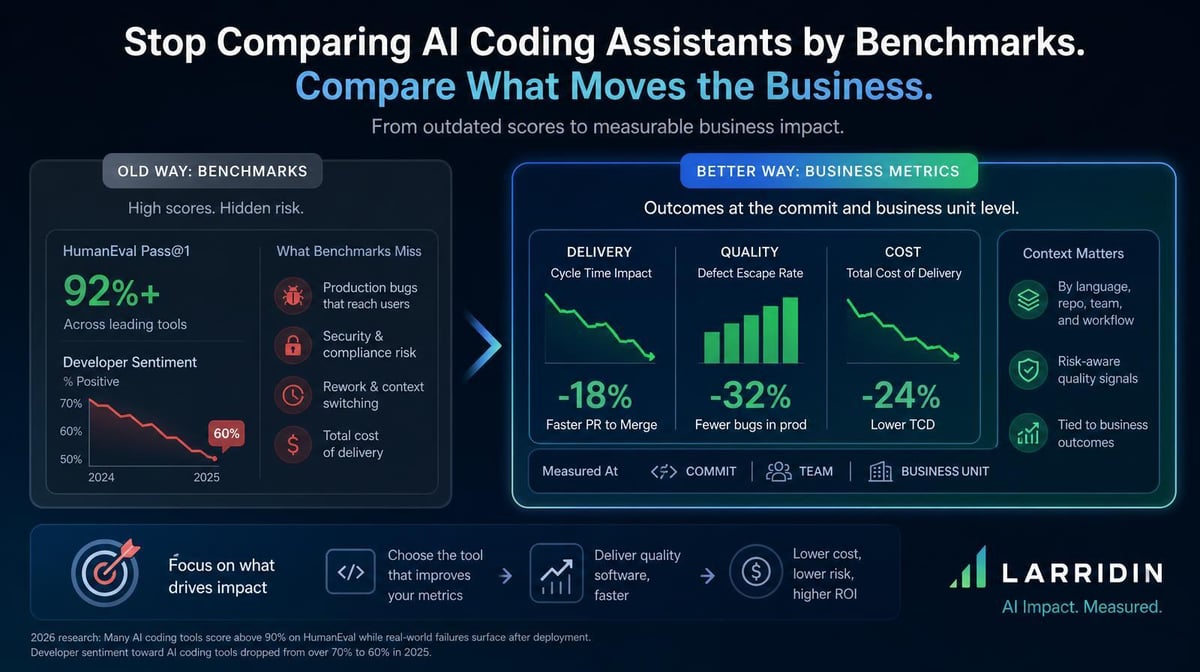

A model can produce syntactically correct code and still introduce known security flaws. Procurement decisions need evidence from your codebase, delivery pipeline, and cost data, not benchmark scores alone.
Key Takeaways
- Veracode’s Spring 2026 research found that syntax accuracy exceeded 95%, while only 55% of tested generation tasks produced secure code across more than 150 large language models.
- New Relic’s 2026 State of AI Coding report found that 82% of respondents had experienced at least one major production failure caused by AI-generated code in the previous six months.
- Comparing AI coding assistants requires measuring delivery, production quality, code durability, security, and cost per outcome by tool in your own engineering environment.
Why Benchmarks Fall Short as a Procurement Tool
Benchmarks such as HumanEval and SWE-bench measure model capability on standardized tasks. They can help identify whether a model can solve a defined coding problem, but they can’t predict how a tool will perform with your codebase, workflows, review practices, and production requirements.
Security is a clear example of the gap. Veracode tested more than 150 large language models and found that syntax accuracy exceeded 95%, while only 55% of tested generation tasks produced secure code when no security guidance was provided.
That doesn’t make standardized benchmarks useless. It means they answer a narrower question than procurement leaders need answered.
Developer confidence has also cooled as adoption has grown. The 2025 Stack Overflow Developer Survey found that positive sentiment toward AI tools fell from more than 70% in 2023 and 2024 to 60% in 2025. The survey doesn’t explain the decline, but the shift gives buyers another reason to test tools against their own delivery, quality, and cost data rather than rely on vendor demonstrations or benchmark scores.
5 Business Metrics That Differentiate AI Coding Tools
1. Delivery Velocity and Stability
Did the team deliver work faster after adopting the tool, and did production stability hold?
Track lead time, deployment frequency, and change failure rate before and after adoption. Read the metrics together. Faster output isn’t an improvement if it requires more review and testing or leads to more incidents and rework.
DORA’s 2025 research describes AI as an amplifier of existing organizational capabilities rather than a guaranteed performance improvement. Your comparison should show what each tool changes in your environment.
2. Production Failure and Rework Rates
New Relic found that 78% of respondents reported more production incidents after AI-generated code entered production, while 74% said at least one-quarter of AI-generated code required significant post-deployment rework.
Track incidents and rework by tool attribution. This shows whether one assistant produces better downstream results than another, rather than simply generating more accepted code.
3. Code Durability at 30 and 90 Days
Code turnover and revert rates show whether AI-assisted work survives after it ships.
In one Larridin customer environment, AI-assisted code had a 0.2% revert rate versus 15.16% for human-only code. In another, 30-day turnover climbed 64.7% alongside rising AI code share.
Our revert rate measurement framework explains how to compare AI-assisted and human-only code across consistent time windows. The same approach can compare durability by tool.
4. Cost per Productive Outcome
License price alone doesn’t show which tool produces the best return.
Compare cost per pull request merged, feature shipped, production-ready change, or another outcome tied to the team’s work. Include seat costs, usage-based charges, enablement, review, and remediation rather than treating the subscription invoice as the full cost.
Larridin’s Token Spend & Insights attributes AI costs across tools, teams, and workflows. The AI Dev Productivity platform connects those costs with delivery and quality signals so leaders can compare spend with what each tool produces.
5. Security Performance in Your Codebase
Veracode’s aggregate results show that security performance varies by language, vulnerability type, and model category. Industry-wide averages can identify risk, but they don’t tell you which tool is safest for your applications.
Test the tools against the languages, frameworks, and security requirements your organization actually uses. For regulated industries and sensitive systems, security failure rate may carry more weight than generation speed.
How to Run a Business-Metric Tool Comparison
Run a parallel pilot across comparable teams doing similar work. Establish the baseline before deployment, define a consistent measurement window, and collect the same delivery, quality, security, and cost metrics for each tool.
Account for major differences in team experience, work type, repository complexity, and release cadence. A tool assigned to a mature platform team shouldn’t be compared directly with one assigned to a team handling unfamiliar legacy code without adjusting the analysis for those differences.
The result should answer three questions:
- Which tool improved the outcome that matters most?
- What did that improvement cost?
- Did the gain hold without increasing production risk or downstream work?
That internal comparison is more useful than declaring a universal winner from aggregate benchmarks.
Frequently Asked Questions
Why don’t AI coding tool benchmarks predict production performance?
Benchmarks test models on standardized tasks under controlled conditions. Production performance also depends on your codebase, ticket quality, available context, engineering practices, edge cases, and security requirements.
What’s the most important business metric for comparing AI coding tools?
It depends on the organization’s primary constraint. Use lead time when delivery speed is the problem, incident and change failure rates when stability is the concern, and cost per productive outcome when budget pressure is driving the decision.
How do we compare AI coding tools when teams use several at once?
Track per-tool attribution across commits, delivery outcomes, incidents, rework, and spend. Larridin’s AI Dev Productivity platform combines GitHub and Jira data with AI contribution and quality signals so leaders can compare Copilot, Cursor, Claude Code, and other tools in the same operating view.
Does any AI coding tool consistently produce better code quality?
The available aggregate research doesn’t establish a universal winner. Veracode found meaningful differences by language, vulnerability type, and model category. Test tools against your own codebase and read those results alongside your review and governance practices.
Compare AI Coding Tools on What They Deliver
Larridin compares AI coding assistants using delivery, quality, durability, security, and cost data at the team and business-unit level. That gives leaders evidence grounded in what the tools produce in their environment rather than laboratory scores alone.
Book a discovery call to set up your AI coding tool comparison.