

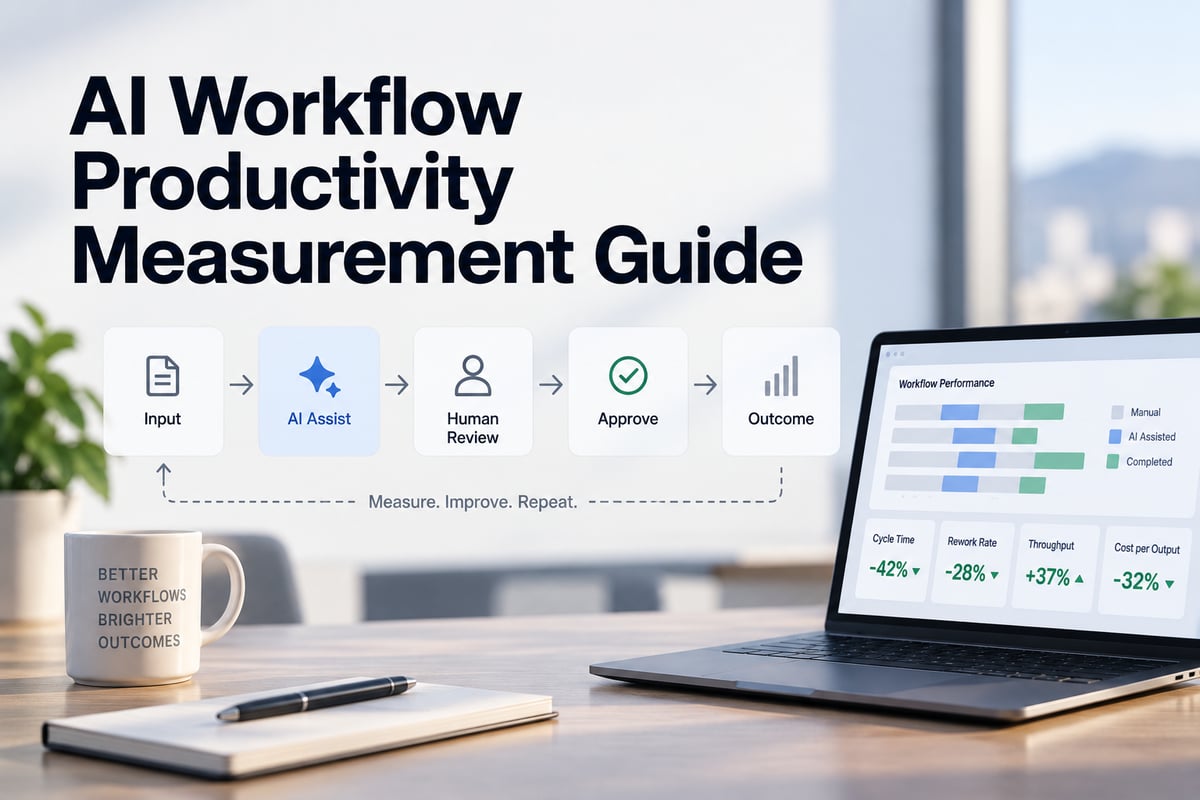

A company can have 90% AI adoption and still take four hours to close a support ticket.
Why?
The AI might draft the reply in seconds, then the ticket sits in an approval queue for three hours.
That’s why usage alone doesn't tell you whether AI improved productivity.
You have to measure the workflow.
This guide shows how to break a business process into stages, measure what happens at each one and determine whether AI actually made the work faster, cleaner or less expensive.
Measure the workflow, not just the tool
Usage dashboards answer one question: Who is using AI?
They don't tell you whether an invoice was approved faster, a support ticket closed sooner or a pull request reached production more quickly.
Workflow measurement starts with the business process instead.
Take a real process such as support ticket resolution, content production, code review or invoice processing.
Break it into stages.
Then measure what changed at the stage where AI entered the process.
We built Larridin's Workflow Intelligence capability around that idea.
Engineering Intelligence focuses on engineering work. Work Intelligence looks across roles and departments. Workflow Intelligence focuses on a specific process and asks a narrower question.
Did AI change the outcome of this workflow?
You can answer that question with a spreadsheet or automate the measurement with software. The method is largely the same.
Step 1. Map what really happens
Start with the actual process, not the version documented six months ago.
Pull several recently completed examples and trace what happened from beginning to end.
Include unofficial handoffs and approval steps.
For example:
- Support tickets might move from intake to triage, drafting, agent review, customer response and resolution.
- Content might move from brief to draft, editorial review, fact-checking and publication.
- Code might move from PR creation through automated checks, human review, revisions, merge and deployment.
- Invoices might move from receipt through data capture, coding, approval and payment.
Keep the stages broad enough to manage, but distinct enough that each one represents a different part of the work.
A whiteboard, Miro board or shared spreadsheet is enough to start.
Step 2. Mark where AI actually enters
AI usually affects one or two stages, not the entire workflow.
It might draft a customer response, extract invoice fields, suggest a code change or summarize a document for review.
- Mark those exact stages.
- Also note where AI is available but rarely used and where no AI is involved.
- This matters because a faster AI-assisted drafting step doesn't automatically mean the whole workflow improved.
The next stage may become the new bottleneck.
Larridin's Scout capture layer is designed to identify which AI tools are being used without reading the underlying content.
You can also start manually by asking teams where AI is used and checking that against available usage logs.
Step 3. Measure four things at every stage
Once the workflow is mapped, track four basic signals.
Cycle time
- How long does work remain in the stage?
- Measure from the moment it enters until it leaves.
Handoff delay
- How long does the work sit between stages?
- This is often where an AI speed gain disappears.
Rework rate
- How often does output get returned, rejected or corrected later?
- A faster first pass isn't useful if another team has to redo it.
Volume
- How many items move through the stage?
- Faster cycle time at higher volume tells you something different from faster cycle time at the same volume.
- Measure these signals for stages with AI and stages without it.
That gives you context for what changed.
You can usually pull the timestamps from systems that already run the process.
Zendesk can provide ticket timestamps. GitHub can provide PR and merge events. Finance platforms can provide invoice and payment dates.
- Put one work item on each row and each stage boundary in its own column.
- From there, cycle time and handoff delays become straightforward calculations.
- For engineering workflows, LinearB is one option for tracking PR cycle time and review stages.
- Its current G2 pricing page lists a free tier, Business at $49 and Enterprise pricing through the vendor.
For broader business workflows, process-mining platforms can reconstruct the process using event data from your existing systems.
- Celonis uses process data to show how work flows through an organization, where inefficiencies occur and where processes differ from the expected path.
- UiPath Process Mining takes a similar approach. It uses data from business systems to visualize processes, identify bottlenecks and find automation opportunities.
These platforms can help reconstruct the workflow.
The harder measurement question comes next.
Did AI cause the improvement?
Step 4. Establish a baseline
- Measure the workflow before comparing AI-assisted performance.
- If AI hasn't launched yet, capture a representative period first.
- If it already launched, use historical data from before the rollout when available.
- Record the same metrics at every stage.
- A good baseline should include enough work to avoid letting one unusually fast or slow period dominate the comparison.
- Higher-volume workflows may stabilize quickly.
- Lower-volume processes may need a longer measurement window.
The goal is simple.
You want to know what normal looked like before AI changed the process.
Without that comparison, a post-launch number has very little meaning.
Step 5. Separate the AI effect from everything else
- This is where measurement gets harder.
- Workflows rarely stay unchanged during an AI rollout.
- Staffing may change.
- Volume may increase.
- A new form may launch.
- A policy may change.
- Any of those can affect cycle time.
- So don't automatically attribute every improvement to AI.
Use three checks.
- Compare the stage AI actually changed
- If AI was introduced during drafting, measure drafting before and after.
- Don't rely only on the end-to-end workflow number.
- Compare similar groups when possible
- Compare teams or work items using AI with similar teams or work items that aren't using it yet.
- Running both during the same period reduces the effect of seasonality and staffing changes.
- Watch rework at the same time
- If cycle time falls while rework rises, the team may simply be moving unfinished work downstream faster.
At Larridin, we frame this through Utilization, Proficiency and Value.
- Are people using the AI tool?
- Are they using it effectively?
- Did that use produce a measurable outcome?
Workflow measurement applies those questions to one specific process.
Step 6. Combine workflows into one business view
One measured workflow gives you a case study.
A group of measured workflows gives leadership a portfolio.
That portfolio can show where AI saved time, where performance barely changed and where adoption remains low.
Keep the core measurements consistent across workflows.
Cycle time should mean the same thing everywhere.
So should handoff delay, rework and volume.
Then compare workflows using measures leadership understands, such as hours saved, cost avoided or capacity created.
Larridin's Workflow Intelligence portfolio view is designed to keep those measurements together once the workflows have been defined.
There is still an important human step at the beginning.
Software can measure a process after the stages are defined.
It can't always tell you where your organization believes the workflow truly starts and ends.
That requires the people who own the work.
Watch for these measurement mistakes
- Several problems show up repeatedly.
- Don't rely only on total cycle time. You won't know which stage created the improvement.
- Don't celebrate higher volume without checking rework.
- Don't compare a busy season against a slow one and call the difference an AI effect.
- Don't measure the AI stage in detail while treating everything around it as one block.
And don't assume a pilot team represents the rest of the organization without checking its baseline performance first.
Start with one workflow
You don't need to instrument the whole company at once.
- Pick one workflow with enough volume to measure.
- Map the real stages.
- Mark where AI enters.
- Track cycle time, handoff delay, rework and volume.
- Then compare what happened before and after.
- That gives leadership something much more useful than an adoption percentage.
- It shows whether AI changed the way work actually gets done.
For more on connecting workflow results with spend and headcount decisions, see our AI monitoring guide for CIOs, our workforce AI measurement guide for CHROs and our AI monitoring platform comparison.
Want to measure where AI actually changes your business processes? Talk with Larridin about Workflow Intelligence.