


One number gets presented at the all-hands. The other one sits in the same dashboard.
That’s a single-metric culture, and AI coding agents are making its blind spots harder to ignore.
Key Takeaways
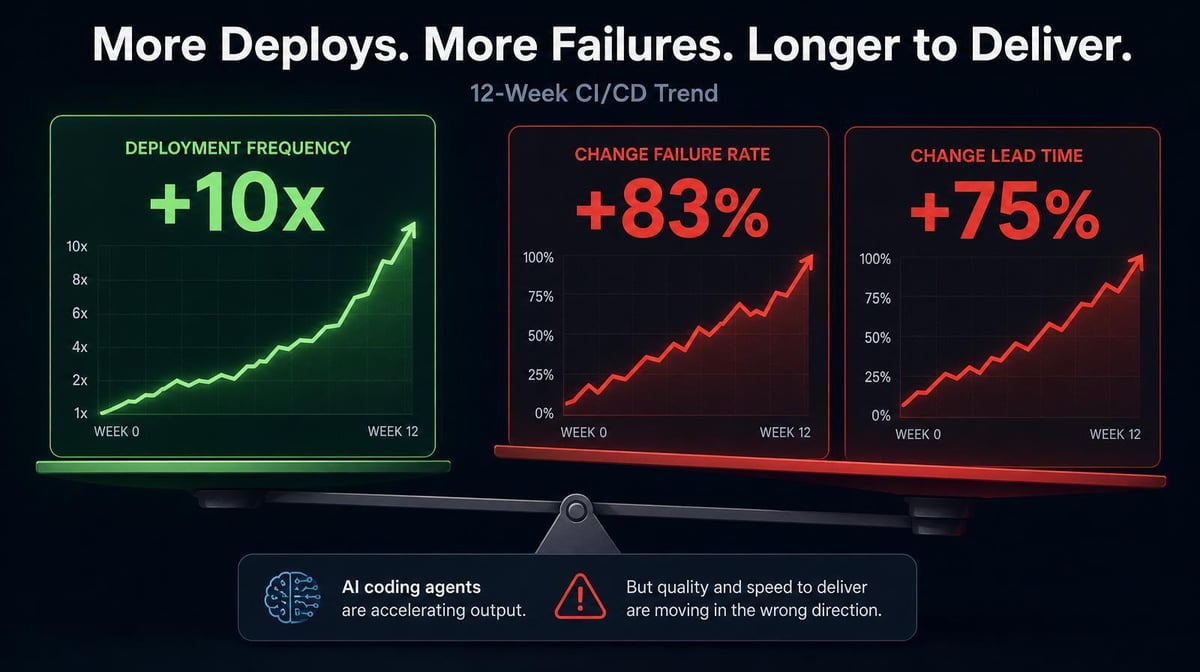
- In a Larridin customer’s CI/CD view, deployment frequency climbed more than 10x over 12 weeks, while change failure rate rose 83% and change lead time rose 75%.
- DORA metrics still show delivery health, but they need to be read together and paired with AI-specific context. Higher frequency alone doesn’t prove better performance.
- External benchmarks show where AI-assisted delivery can stall: CircleCI found feature-branch throughput rose 15% for the median team, while main-branch throughput fell 7%. LinearB found agentic PRs waited 5.3x longer for review pickup at the 75th percentile.
What the Customer Data Actually Shows
Deployment frequency climbing 10x is the kind of number that ends up in a board deck. In a Larridin customer’s engineering environment, that’s exactly what happened over 12 weeks. The number was real.
What the board deck didn’t show: change failure rate rose 83% in the same window, and change lead time rose 75%. The team was deploying more often, but more deployments were failing, and each change was taking longer to move from commit to production.
CircleCI’s 2026 delivery data shows the broader version of the same risk: the median team increased feature-branch throughput 15% year over year while main-branch throughput fell 7%. LinearB’s benchmarks help explain where work can stall: at the 75th percentile, agentic PRs waited 5.3x longer for review pickup than unassisted PRs.
The customer data doesn’t prove review caused all of the additional lead time. It does prove that more releases didn’t translate into a cleaner, faster delivery system. The review bottleneck is one place leaders should investigate, alongside validation, integration, and recovery.
DORA Metrics Need AI-Specific Context
DORA’s software delivery metrics measure throughput and instability across an application or service:
- Deployment frequency shows how often changes reach production.
- Change lead time shows how long they take to get there.
- Change failure rate shows how often deployments require immediate remediation.
Read together, they still give leaders a useful view of delivery health.
What they don’t do on their own is attribute an outcome to AI or human work. A deployment is counted the same way regardless of how the code was produced. Without context such as AI code share, review behavior, and code durability, leaders can see that the pipeline changed without knowing why or whether the gains will hold. The failure modes hidden by traditional productivity metrics become harder to ignore as AI-generated volume grows.
3 Metrics That Have to Move Together
1. Deployment Frequency Needs Change Failure Rate
Deployment frequency rising 10x is a positive activity signal. An 83% increase in change failure rate means it can’t stand alone as evidence of improvement. Leaders need to see whether the additional release volume is producing more successful changes or simply more failed deployments.
2. Lead Time Shows Whether Speed Survives the Pipeline
Change lead time rose 75% in the same customer view. The full path from commit to production got slower even as release frequency increased. That means the constraint sits somewhere downstream of code generation.
Review is a clear place to investigate when agentic PR queues are growing, but it isn’t the only possibility. Your AI measurement and optimization layer should show whether time is accumulating in review, validation, integration, or another stage rather than assume the answer.
3. Recovery Time Shows Whether Failures Are Contained
Failed deployment recovery time, often still reported as mean time to recovery (MTTR), shows how quickly a team can restore service after a failed change. If the change failure rate rises, recovery time reveals whether those incidents are contained quickly or compounding.
A higher failure rate paired with slower recovery is a delivery health problem, even when deploy count looks impressive.
What a DORA-Aware AI Engineering View Requires
The measurement gap is context. Larridin’s DORA-aware AI Dev Productivity platform puts deployment frequency, change failure rate, and lead time in the same view, then adds AI-specific measures such as AI code share, code durability, workflow friction, and ROI. Leaders can see whether AI-generated activity is turning into shipped, durable value—and where it’s getting stuck.
Token Spend & Insights adds the cost side by consolidating token usage and billed spend and attributing it to teams, agents, and projects. That connects delivery performance to what the organization is actually paying for it.
Frequently Asked Questions
Why don’t DORA metrics capture the full picture of AI-assisted engineering?
DORA metrics measure delivery outcomes, not what produced them. They can show that deployment frequency, lead time, or failure rates changed, but they don’t attribute the change to AI-generated code. Leaders need AI code share, review behavior, durability, and cost context to understand the cause and business impact.
What should engineering leaders watch alongside deployment frequency?
At minimum, watch change failure rate, change lead time, and failed deployment recovery time. For AI-assisted engineering, add AI code share, review queue depth, and code durability so higher activity can be connected to delivery quality and lasting value.
How do AI coding agents affect change lead time?
They can reduce coding time while increasing the volume entering review, validation, and integration. Total lead time improves only when those downstream stages keep pace. If lead time rises after AI adoption, leaders should identify where work is waiting instead of assuming faster generation improved the full pipeline.
What does a healthy DORA profile look like after AI coding tool adoption?
Deployment frequency rises, change lead time shortens, change failure rate stays stable or falls, and recovery stays fast. The goal is higher throughput with stable quality and shorter delivery cycles. If frequency rises while failure rate and lead time also rise, AI is increasing activity without improving the system as a whole.
Get the Full DORA Picture for Your AI-Assisted Engineering Team
Larridin’s DORA-aware developer productivity view puts frequency, failure rate, and lead time together with the AI-specific context leaders need to interpret them.
Book a discovery call to see whether your AI coding investments are improving delivery quality, not just volume.