


Key Takeaway
AI adoption analytics reveals which teams use which tools, how often they return, and where use becomes part of work. Enterprise usage data connects those patterns with proficiency, cost, and outcomes. Native reports such as Google Workspace's Gemini analytics are useful inputs, but one provider's view does not cover the full tool portfolio.
What Is AI Adoption Analytics?
AI adoption analytics measures AI use across tools, teams, roles, and workflows. It separates access from actual use, first use from retention, frequency from effective integration, and activity from business results.
- Adoption: How broadly and deeply AI becomes part of work, using a defined population, period, and qualifying behavior.
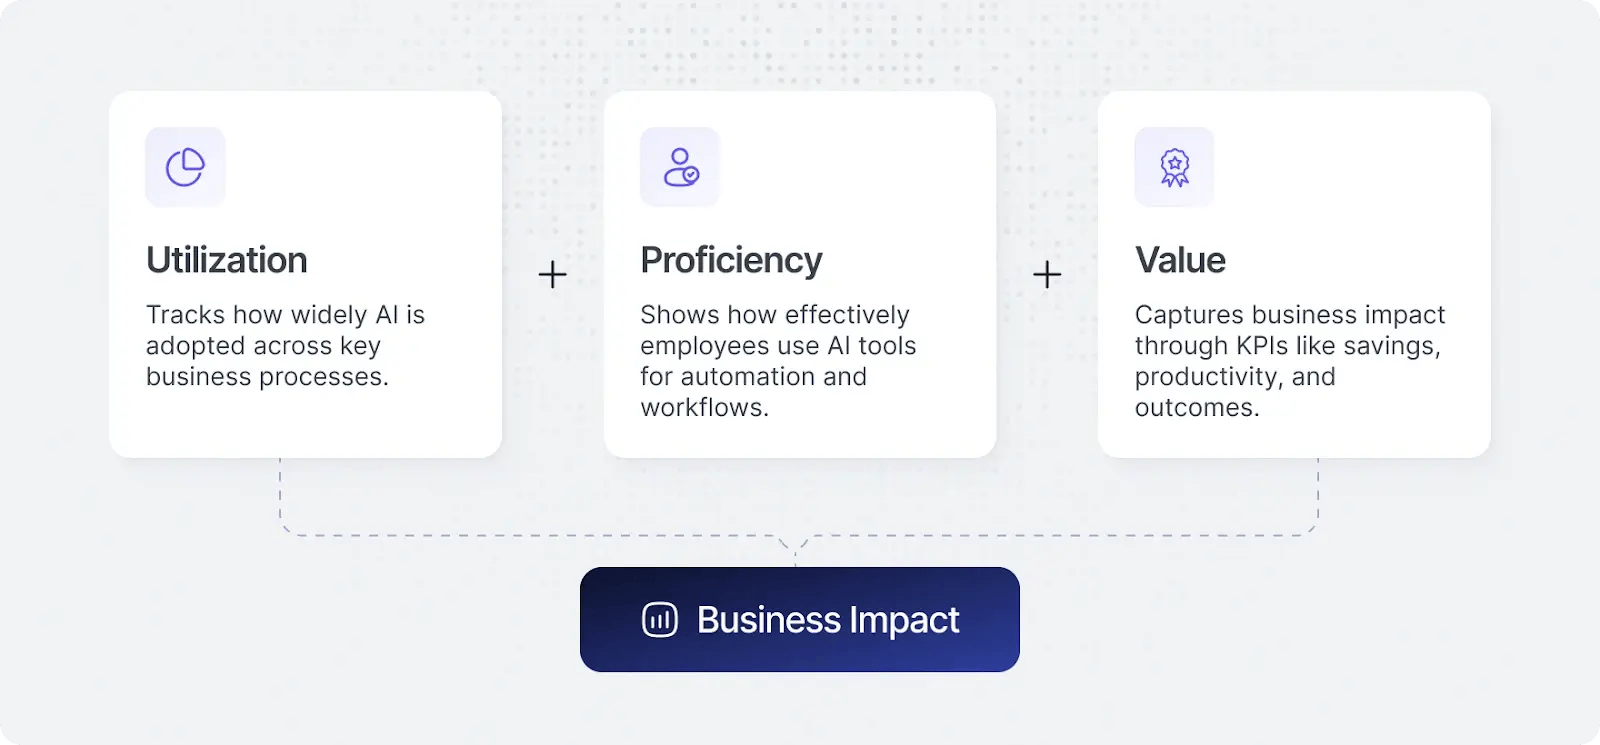
- Utilization: Whether and how often tools are used.
- Proficiency: How effectively people select, guide, verify, and integrate AI.
- Value: Changes in accepted outcomes assessed alongside quality, cost, and rework.
- Shadow AI: Activity outside approved procurement or oversight.
- Usage data: Available records of tool activity, features, sessions, models, and related participation; outcome evidence may require other systems.
License records describe purchased capacity and commitments. They do not establish effective use or better results. Usage analytics adds evidence, not an automatic ROI conclusion.
Separate Five Measurement Questions
- Reach: Who is eligible, has access, has tried a tool, or currently uses it?
- Frequency and retention: Who returns after first use and how consistently?
- Workflow depth: Which tasks and process stages involve AI?
- Proficiency: Are task grounding, tool selection, steering, and verification effective?
- Outcomes: Does accepted work improve after quality, effort, and cost are considered?
Record the denominator, period, event definition, and source for every rate. Eligible employees, licensed users, activated accounts, and active users are different populations. Current use, intent to use, and daily use cannot be subtracted or compared without compatible definitions.
.avif)
Build the Enterprise Usage-Data Foundation
The enterprise AI usage-data guide extends the adoption view into a common record for technology, finance, and business decisions.
Collect Sources According to the Evidence Needed
- Procurement and licensing: Seats, contracts, plan tiers, commitments, and renewal dates.
- Native platform reports: Product-specific active use, features, models, and available usage or cost records.
- Supported browser and desktop telemetry: Tool discovery and activity across covered environments.
- API, cloud, gateway, and orchestration data: Available requests, models, token usage, agents, and execution records.
- Workflow and business systems: Accepted outputs, stage timing, quality, rework, completion, and relevant KPIs.
- Surveys and interviews: Sentiment, confidence, friction, task fit, and barriers that technical records may not explain.
No source provides guaranteed coverage of every application, device, personal account, or agent step. Document blind spots, delayed records, failed integrations, and whether a measure is observed, estimated, or inferred.
Normalize Before Rolling Up
Map identities, teams, roles, tools, workflows, and time periods across sources. A person active in Gemini, Claude, and ChatGPT is still one person. Per-tool adoption may overlap and should not be added as a count of unique enterprise users.
Preserve provider-specific definitions alongside shared ones. A counted feature interaction in one product may not be equivalent to a session in another. State how duplicates, shared accounts, service accounts, and uncertain identity matches are handled.
For agent work, retain the workload, owner, run, and relevant outcome where available. Separate human-driven use and agent execution rather than folding both into a headcount-based active-user rate.
Make Cost per Active User a Scoped Measure
Dividing a defined cost total by active users helps reveal utilization economics beyond cost per assigned seat. Use the same period and scope, account for pooled allowances, and disclose whether the numerator includes only licenses or also consumption and operating costs.
This ratio does not establish user productivity. A low-frequency user may create substantial value, while a high-frequency user may be retrying unsuccessful work. Pair the financial view with workflow and outcome evidence.
Break Adoption Down by Department and Role
Retain a common measurement language while selecting outcomes appropriate to the function. Company averages can conceal stalled adoption or friction within a team.
- Engineering: Connect use with review, delivery, durability, defects, security, and cost per accepted work.
- Sales and support: Follow use into completed activity, response, resolution quality, escalation, and customer outcomes.
- Marketing: Measure brief-to-publication timing, editing, quality, and relevant campaign results rather than draft volume alone.
- Finance and operations: Assess cycle time, accuracy, exceptions, review, and completion in recurring processes.
- People and HR: Examine approved workflows with privacy, fairness, quality, and human oversight.
Role-level data should support appropriate enablement and workflow diagnosis, not rank people by activity. Managers need distributions and bottlenecks; executives need cost, risk, and outcome summaries with clear limits.
For the extended segmentation approach, see AI Workforce Analytics by Department and Role.
Measure Retention and Depth, Not Only First Use
Define daily, weekly, and monthly active use consistently. Interpret the cadence against the work: a monthly reporting task does not need daily AI use, and long sessions do not necessarily mean greater capability.
Group users by first-use period and track returns. Distinguish those who never started from those who tried and stopped. Investigate access, onboarding, reliability, workflow fit, or friction before choosing the response.
Engineering provides a worked example: frequency and AI-assisted code share describe participation, while delivery, review, quality, and rework describe the results. AI used for research or debugging may not create much attributed code but can still support useful work.
See the daily-use and adoption-gap analysis for further distinctions among headline adoption, retention, and integration.
What Native Gemini Reports Add, and Where They Stop
The Google Workspace Gemini reporting comparison illustrates why native reporting should be used, not dismissed.
The source describes organization- and user-level reports covering licensed populations, adoption, per-app use across Workspace, Gemini chat activity, and feature-limit signals. Exact availability and counting rules depend on the report and product configuration; validate them in the relevant Google documentation and admin environment.
Those records can answer which covered Gemini capabilities are used and where activity is concentrated. Some features may be counted differently depending on the surface where they run, so preserve the report's definition before comparing periods or products.
Use Native Reporting for the Question It Answers
If the decision is a Gemini rollout or feature-adoption assessment, native reports may supply much of the required usage evidence. They do not show activity in external products such as ChatGPT, Claude, or Microsoft Copilot.
High reported intensity is not demonstrated proficiency. Native adoption data alone also does not establish workflow improvement, total enterprise AI cost, or net financial return. Those questions require additional capability, billing, and outcome records.
Build a Cross-Tool View Without Flattening the Differences
Combine native Gemini data with other sources using common identity and period rules. Keep per-app and per-feature context so a summary does not conceal which workflows employees actually use.
Evaluate tools within similar tasks and populations. A product used for scheduled meetings should not be judged against an agent used for continuous engineering work solely through interaction frequency.
Cross-tool analytics complements native reports; it does not make every product event equivalent or automatically fill missing data.
Discover Shadow AI Without Confusing Visibility With Compliance
Compare purchased and approved tools with discovered activity. Investigate embedded features, team subscriptions, personal accounts, and agents where coverage permits.
Usage metadata can initiate assessment but does not establish what content was uploaded, whether an output was correct, or whether a legal violation occurred. Connect findings with owners, data-handling requirements, security review, and appropriate controls.
Discovery supports governance rather than independently certifying compliance. An unapproved tool may represent material risk, an unmet business need, or both; route it through an accountable assessment and containment process.

Keep Utilization, Proficiency, and Value Together
Utilization, Proficiency, and Value organize complementary evidence. They are not a literal mathematical ROI formula.
High utilization with flat outcomes may indicate tool fit, data, process, integration, proficiency, or review constraints. Strong capability evidence without an accepted result still leaves the business case incomplete. Improved results with higher costs require a scoped net-value assessment.
Compare similar workflows and account for staffing, complexity, seasonality, other automation, and selection effects. A correlation between use and performance is a signal to investigate, not proof that AI caused the change.
Distinguish financial savings, released capacity, faster elapsed delivery, and additional output. Operational improvement informs ROI; monetization and realization require separate evidence.
Implement Adoption Analytics Around Decisions
- Define the questions: Decide what leaders need to know about access, enablement, retention, costs, workflows, or governance.
- Inventory sources: Identify procurement, native reports, telemetry, billing, and outcome systems, documenting coverage.
- Agree on definitions: Specify populations, active behavior, time windows, retention, agent separation, and uncertainty.
- Normalize identities and segments: Map team, department, role, tool, and workflow with appropriate access controls.
- Pilot and validate: Check events, joins, duplicates, reporting delays, and privacy before expanding.
- Attach cost and outcomes: Start with relevant existing measures and targeted integrations; do not wait for a perfect enterprise-wide data estate.
- Act and remeasure: Assign findings to owners and assess whether support or workflow changes improve results.
Deployment time depends on scope, permissions, data quality, identity mapping, and integrations. Separate initial tool visibility from a defensible outcome or ROI assessment.
Privacy, Interpretation, and Employee Trust
Collect the minimum needed, explain the purpose, define retention, and restrict access. Favor aggregated team and workflow insights when they answer the question. Aggregation and metadata collection do not automatically remove personal-data obligations.
Behavioral patterns do not directly prove prompt meaning, content quality, or individual capability. Combine appropriately governed practical and outcome evidence where necessary, and assess employment uses separately from general adoption improvement.
Use the Reporting Cadence to Change the Work
Operational reviews can identify new tools, activity drop-offs, missing data, cost spikes, or growing friction. Leadership reviews can examine portfolio decisions, development priorities, renewal assumptions, and outcomes. Choose the cadence according to materiality and risk.
Each important finding needs a next question and an owner. Low retention can require reliability or task-fit investigation. Strong use with weak quality may require better verification. Overlapping tools may justify consolidation only after capability, migration, and business need are understood.
Larridin connects adoption, proficiency, spending, and outcomes across tools and teams. Confirm the coverage and definitions required for your environment rather than assume a dashboard supplies all evidence automatically.
Frequently Asked Questions
What is AI adoption analytics?
It measures who uses which tools, how often they return, and where use fits into work. Connecting it with proficiency, costs, and outcomes supports better decisions than license or login counts alone.
Are native Gemini reports useful?
Yes. They provide meaningful product-specific adoption and usage evidence. Validate counting rules and report coverage. Add outside data when the question includes other tools, workflow results, or full enterprise economics.
Can Gemini reporting measure companywide AI ROI?
Not by itself. Native usage reports do not include external AI products or independently establish proficiency, complete cost, and business outcomes across the organization.
Can we add active-user totals across vendors?
Not as unique enterprise users without deduplication. People may use several tools, and each provider can count activity differently. Normalize identity, period, and event definitions while preserving source-specific context.
Should every team target daily use?
No. The cadence should fit the workflow. Retention, task integration, quality, and results matter more than a universal activity quota.
Can usage analytics be privacy-conscious?
Yes, with defined purpose, minimized data, transparency, retention, aggregation, and access controls. Metadata has inference and privacy limits; do not represent it as complete content or individual-performance evidence.
Which metrics matter most?
Use defined reach, active use, retention, workflow depth, and proficiency measures by relevant segment. Add cost, quality, rework, completion, and governance context. No one signal establishes value.
How does analytics support training?
It locates patterns worth investigating, such as never starting, not returning, shallow task integration, or repeated correction. Determine the cause, target support, and verify sustained improvement rather than count course completion as success.
Turn Adoption Evidence Into Decisions
The objective is not a bigger adoption percentage. It is understanding where tool use becomes dependable work and what investment or intervention would improve the result.
Use native reports for product depth. Normalize sources for portfolio visibility. Preserve definitions and uncertainty. Then connect the usage record with the outcomes leaders need to decide what happens next.